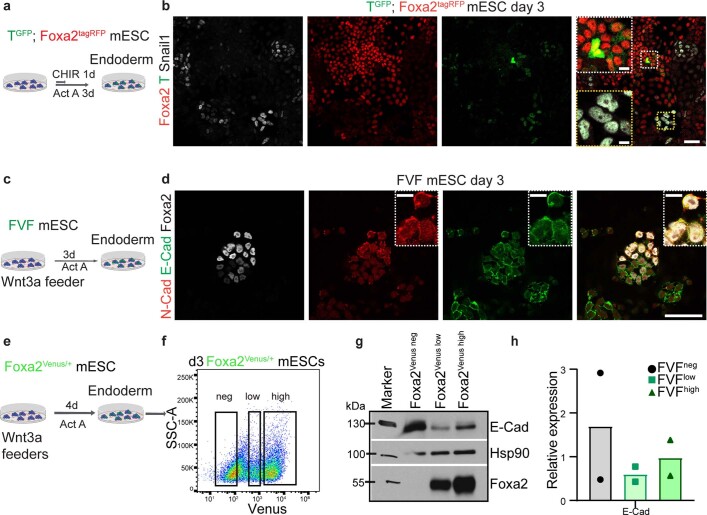
Extended Data Fig. 4. Endoderm does not show hallmarks of EMT in vitro.
a, Endoderm differentiation scheme of TGFP/+; Foxa2tagRFP/+ mESC line. b, Confocal images of differentiated TGFP/+; Foxa2tagRFP/+ mESC line (representative of 3 independent differentiations) at day 3 stained for GFP (T), Foxa2 and Snail1. Note, the presence of T+, Snail1+ MES population (yellow box), Foxa2high/T+ AME progenitors (white box) as well as Foxa2low/high DE progenitors, recapitulating the observations in vivo. c, Differentiation scheme of FVF mESCs towards endoderm fate. d, Confocal images of differentiated FVF mESCs (representative of 2 independent differentiations) at day 3 stained for Venus (Foxa2, white), E-cadherin and N-cadherin. e, Scheme of endoderm differentiation. f, Representative FACS plot of Foxa2Venus/+ cells after 3 days of differentiation, followed by FACS sorting of Foxa2Venus neg, Foxa2Venus low, Foxa2Venus high for (g) western blot analysis (2 experiments) and (h) quantification of E-cadherin (n = 2 experiments). All samples are derived from biologically independent experiments. Data are presented as mean values. All shown confocal images are single planes of a z-stack unless otherwise stated. Scale bar: 50 µm, insets 10 µm.

