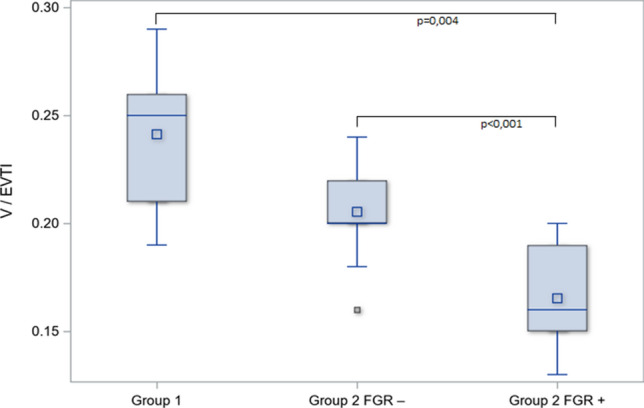
Fig. 3.

The differences in median levels of vascularization index with FGR subgroup analysis. FGR subgroup within preeclamptic patients (Group 2 FGR+) was compared to eutrophic fetuses from preeclampsia (Group 2 FGR−). Kruskal–Wallis test was employed to check the differences in V/EVTI between Group 1 and subgroups within Group 2 with post hoc analysis. The box-and-whiskers chart displays basic statistics: mean, median, first and third quartiles as boxes. The extending lines from the boxes indicate variability outside the upper and lower quartiles. The whiskers shows the maximum/minimum observation below/above 1.5 times IQR (interquartile range) from the appropriate quartile. Outliers are plotted as single points. The lowest vascularization index (V/EVTI) was observed in placentas examined in pregnancies complicated with preeclampsia and FGR (median 0.16; IQR 0.15–0.19) compared to eutrophic fetuses from preeclampsia (median 0.20; IQR 0.20–0.22), p < 0.001
