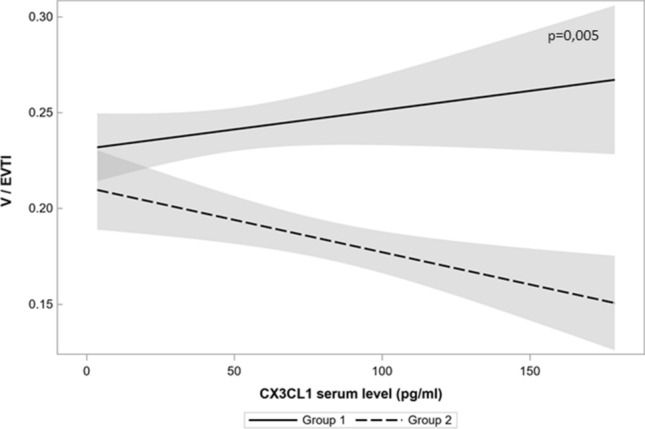
Fig. 4.

The regression model shows a significant influence of preeclampsia for partial correlations between CX3CL1 serum level and vascularization index (V/EVTI). In the upper right corner of each graph, p value is shown. Solid line represents a regression curve in Group 1 and intermittent line in Group 2, grey zones represent 95% confidence intervals. In the model, the difference between partial correlations due to influence of preeclampsia was statistically significant at p = 0.005. Beta coefficient (slope) in the linear relations between CX3CL1 serum level and vascularization index in the absence of preeclampsia was 0.0002 (p = 0.169), but in case of preeclampsia, the decrease of the coefficient beta was − 0.00034 (p = 0.005). The criterion of the accuracy of the approximation r2 was 0.59
