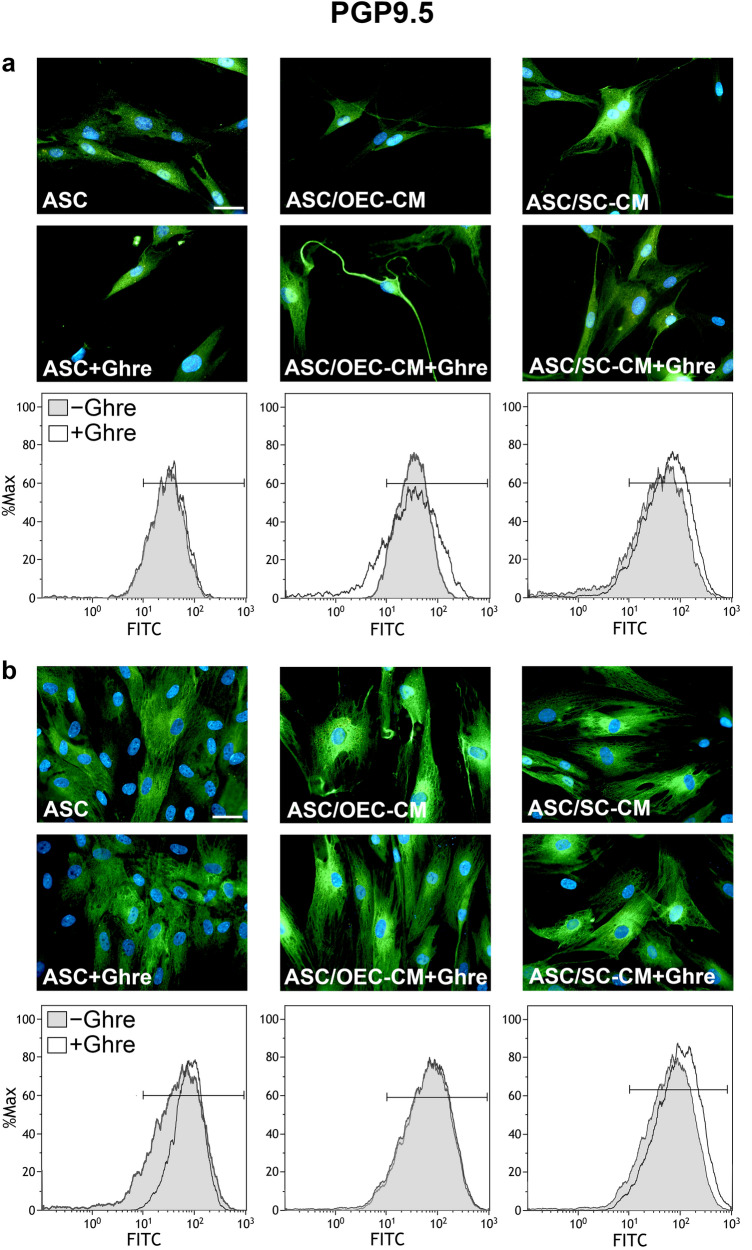
Fig. 1.
Modifications of PGP9.5 expression at 1 and 7 days of culture in ASCs undergoing different treatments. In panel a (1 day) and b (7 days), PGP9.5 immunoreactivity is shown in different groups of ASCs: ASC cultures in the basal medium (ASC); ASC cultures in OEC-CM (ASC/OEC-CM) or SC-CM (ASC/SC-CM); ASC cultures where ghrelin was added to the basal medium (ASC + Ghre), to OEC-CM (ASC/OEC-CM + Ghre) or to SC-CM (ASC/SC-CM + Ghre). In each flow cytometry plot, data obtained from each culture condition, with or without ghrelin, are merged. Histograms show cell frequency distribution of each population, according to FITC fluorescence intensity expressed in logarithmic scale. Histogram overlays are displayed as %Max, scaling each curve to the respective modal values = 100%. Scale bar: 50 μm

