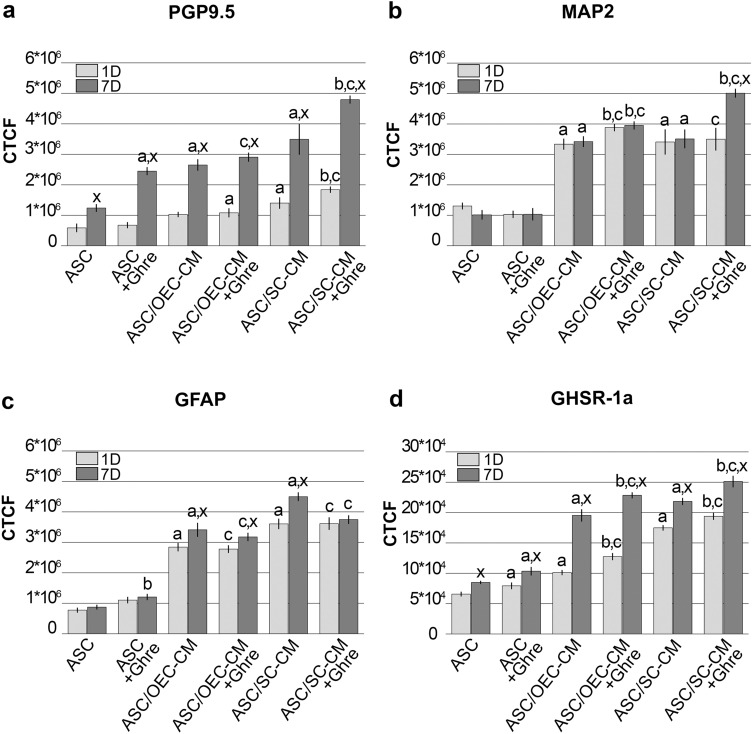
Fig. 5.
Histograms showing fluorescence quantification data for neural markers in each ASC group at day 1 and 7. a PGP9.5, b MAP2, c GFAP, d GHSR-1a. Bars represent CTCF mean value ± SD, obtained from at least three independent experiments. aSignificant differences (P < 0.01) vs ASCs; bSignificant differences (P < 0.01) between the CM + Ghre treatment and the CM treatment alone; cSignificant differences (P < 0.01) between CM + Ghre treatment and ASC + Ghre; xSignificant differences (P < 0.01) between data at 7 days and 1 day of culture

