Fig. 1.
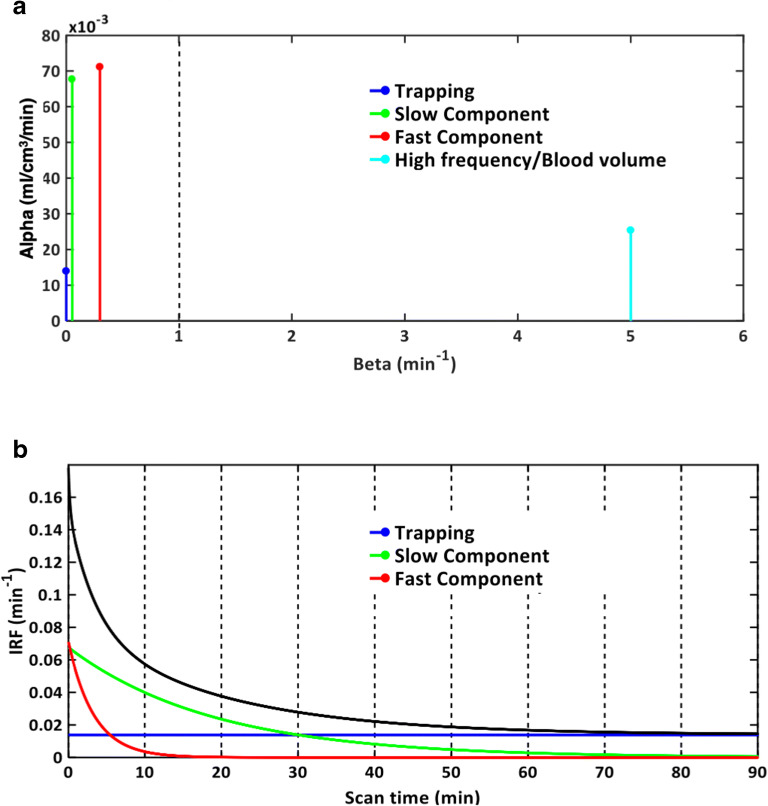
SA kinetic spectrum and impulsive response function. a Representative kinetic spectrum for a healthy subject, which revealed 4 different components: a trapping for β = 0 (blue), a slow component for β = 0.053 min−1(green), a fast component for β = 0.300 min−1 (red), and high frequency component for β = 5 min−1(cyan) likely to be associated to fractional blood volume. b Associated impulse response function (IRF) for tracer activity (black line) which was measured by the sum of three individual tissue components of the spectrum (blue, green, and red curves, respectively).

