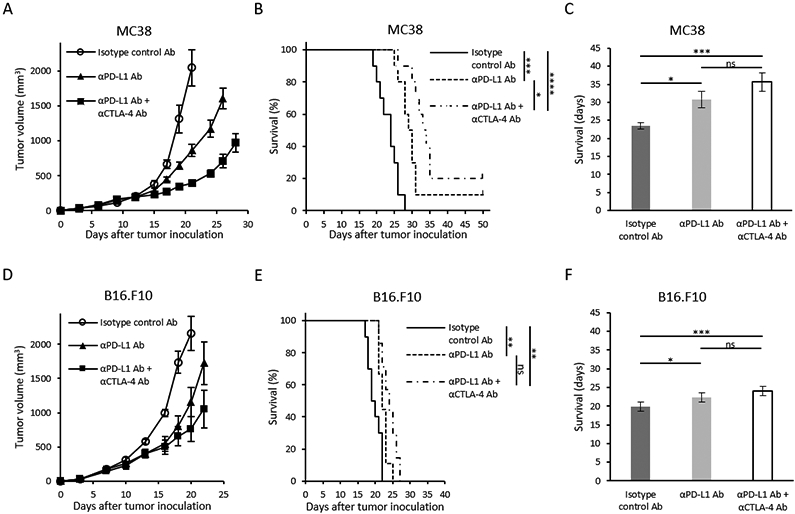
Figure 1. Tumor growth and survival of immune checkpoint blockade therapy in two murine tumor models with different sensitivity.

(A and D) Growth kinetics of each tumor. MC38 or B16-F10 inoculated mice were treated with either Isotype control Ab, anti-PD-L1 Ab, or combination anti-PD-L1 Ab + anti-CTLA-4 Ab on days 9, 12, and 15 post tumor inoculation (n = 5 per group). Data are shown as mean ± SE at each time point. (B and E) Kaplan-Meier survival curve for each tumor (MC38; n = 10 per group, B16-F10; n =7-10 per group). Survival refers to the time before reaching the maximally allowed tumor volume of 2,000 mm3. (C and F) Bar plot of survival from figure B and E. Data are shown as mean ± SE. Statistical significance between groups was determined by log-rank test for B and E, and by Tukey-Kramer test for C and F. *p < 0.05, **p < 0.01, ***p < 0.001 ****p < 0.0001.
