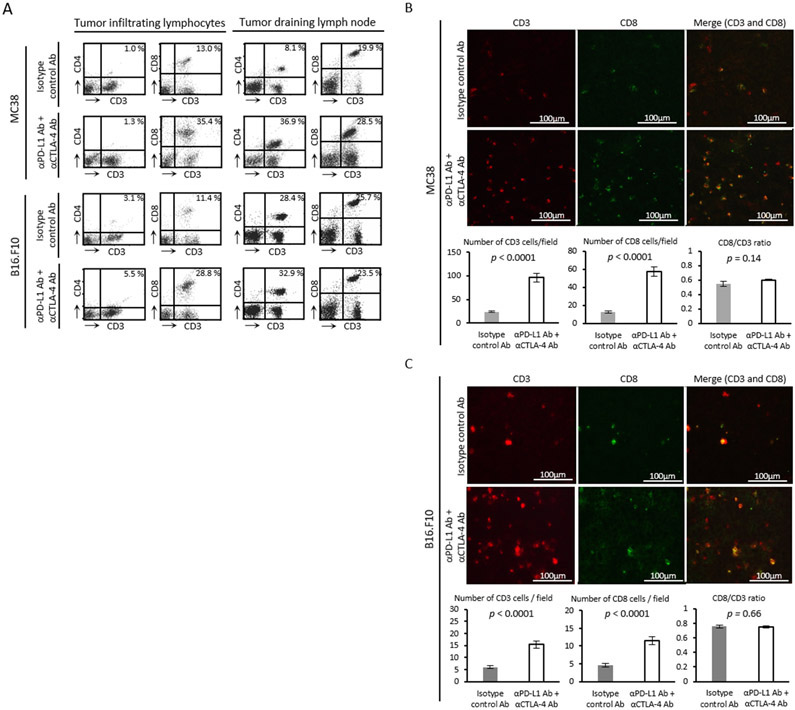
Figure 2. In vivo treatment effect of immune checkpoint blockade therapy.
(A) Flow cytometry analysis of tumor infiltrating lymphocytes and tumor draining lymph node cells. Tumor bearing mice were treated with each Ab on day 9 and 12. Tumors and lymph nodes were harvested on day 13. The figure on each plot shows the percentage of CD3+CD4+ T cells or CD3+CD8+ T cells. (B and C) Immunofluorescence staining of CD3 and CD8 in MC38 tumor (B) or B16-F10 tumor (C) (scale bar = 100 μm). Tumor bearing mice were treated with each Ab on day 9 and 12. Tumors were harvested on day 13. Number of cells were manually counted in randomly selected 5 fields per tumor section (MC38; n = 4 per group, B16-F10; n = 5 per group). Data are shown as mean ± SE. Statistical significance between groups was determined by Student’s t test.

