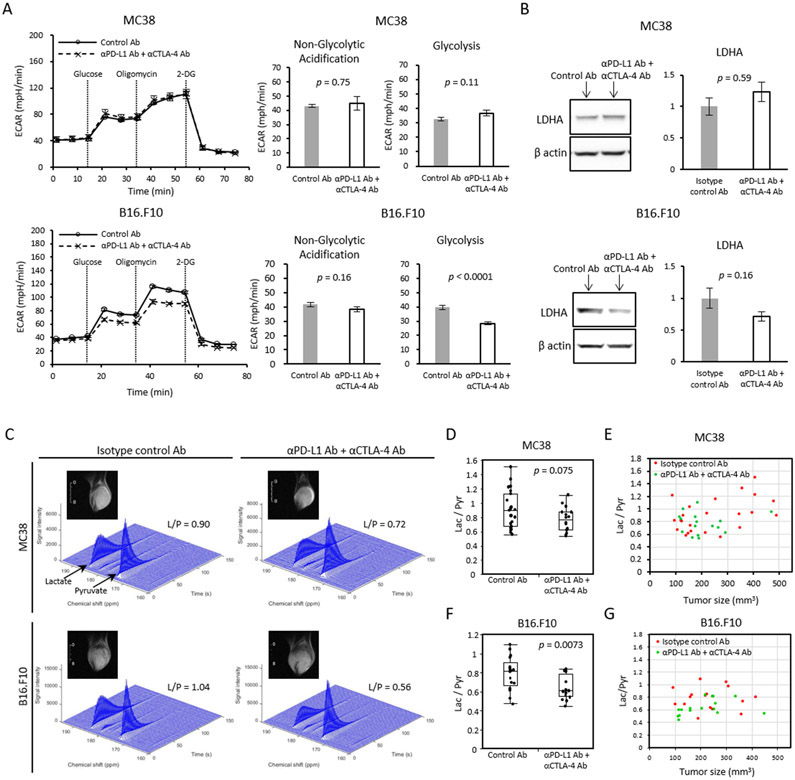
Figure 3. Metabolic shift induced by immune checkpoint blockade can be detected in selected cancer whose metabolism relies on glycolysis.
(A) Extracellular acidification rate (ECAR) of MC38 and B16-F10 cells in vitro. Tumor cells pre-treated with IFN-γ for 48 h followed by anti-PD-L1 Ab + anti-CTLA-4 Ab or isotype control Ab for 24 h were measured (n = 5 per group). For each time point, mean ± SE is plotted. Bar plots show the parameters (non-glycolytic acidification and glycolysis) calculated from ECAR kinetics. Data are shown as mean ± SE. (B) Western blot analysis for LDHA on in vivo ICB treated tumor. MC38 or B16-F10 tumor bearing mice were treated with isotype control Ab or anti-PD-L1 Ab + anti-CTLA-4 Ab on day 9 and 12. Tumors were harvested and processed on day 13. Bar plot shows the quantification of protein bands. Data are shown as mean ± SE. The mean of the control group is set as 1 (n = 5 per group). (C-G) MRI of hyperpolarized 13C pyruvate metabolism in two murine tumor models. Tumor bearing mice treated with isotype control Ab or anti-PD-L1 Ab + anti-CTLA-4 Ab were scanned after the 2nd injection of antibodies (MC38; n = 23, n = 16 each group, B16-F10; n = 17, n = 16 each group). (C) Representative dynamic 13C spectra of MC38 and B16.F10 tumor and T2-weighted 1H anatomical image. (D and F) Lactate to Pyruvate (Lac/Pyr) ratio of MC38 (D) or B16.F10 (F) sorted by treatment. Data are shown as box-and-whisker plot (median, maximum, minimum, first quartile, and third quartile); individual values are shown. (E and G) Correlation between Lac/Pyr ratio and tumor size in MC38 (E) and B16.F10 (G). Statistical significance between groups was determined by Student’s t test for A, B, D, and F.

