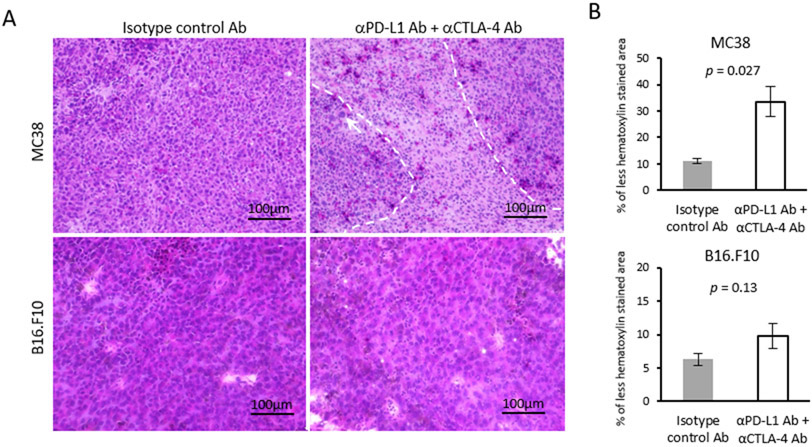
Figure 5. Histological assessment of HE staining.
(A) Representative hematoxylin and eosin staining (HE) of MC38 and B16-F10 tumors (scale bar = 100 μm). MC38 or B16-F10 tumor bearing mice were treated with each Ab on day 9 and 12. Tumors were harvested on day 13. (B) Quantification of hematoxylin stained area. Data are shown as mean ± SE (MC38; n = 4 per group, B16-F10; n = 5 per group). Statistical significance between groups was determined by Student’s t test.

