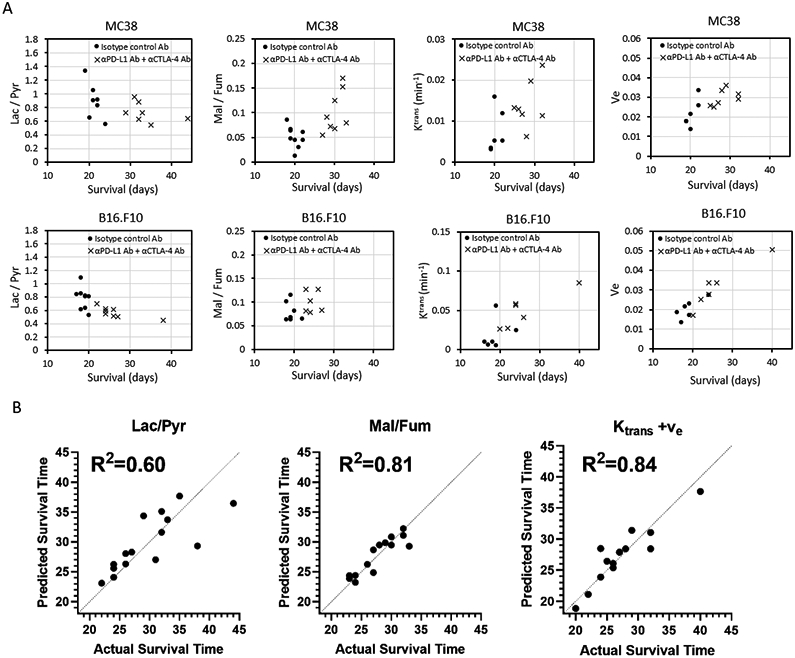
Figure 7. Correlation between imaging markers and clinical outcome.

(A-C) Some of experimental mice scanned by 13C Pyruvate MRI, 13C Fumarate MRI, or DCE-MRI in Figure 3, Figure 4, or Figure 6 were followed until the end of their clinical endpoint to determine their survival. The survival data of these mice (MC38 and B16-F10) treated with both PD-L1 and CTLA-4 dual blockade was examined for the prognostic capability of each imaging biomarker. Survival refers to the time before reaching the maximally allowed tumor volume of 2,000 mm3. (A) Correlation between Lac/Pyr ratio and survival in MC38 and B16-F10 (MC38; n = 7 per group, B16-F10; n = 9, n = 8 each group). (B) Correlation between Mal/Fum ratio and survival in MC38 and B16-F10 (MC38; n = 9, n = 8 each group, B16-F10; n = 7, n = 6 each group). (C) Correlation between Ktrans and survival in MC38 and B16-F10 (MC38; n = 6, n = 7 each group, B16-F10; n = 6 per group). (D) Correlation between Ve and survival in MC38 and B16-F10 (MC38; n = 6, n = 7 each group, B16-F10; n = 6 per group). (E) Correlation between the Lac/Pyr ratio, Mal/Fum and Ktrans/ve in a multilinear regression model using tumor volume and each imaging biomarker with cell type as a categorical variable.
