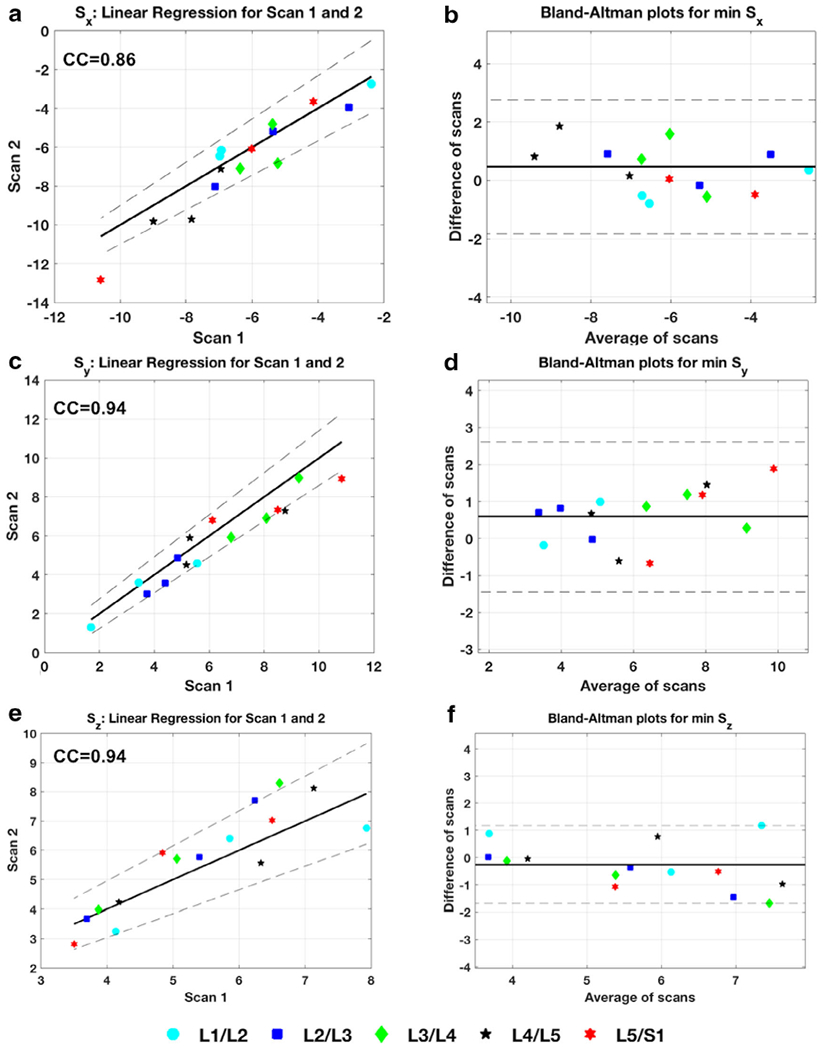
FIGURE 6:

Repeatability of strain in vivo. (a), (c), and (e) show the scatter plot of the strain measurements from scan 1 and scan 2 in the regions of interest (ROIs) tested for Sx, Sy, and Sz directions. Strong correlation coefficient measurements demonstrate the repeatability of the technique between scans. (d), (e), and (f) are the Bland-Altman plots showing data from the average of the scans plotted against the differences.
