
Figure 5.
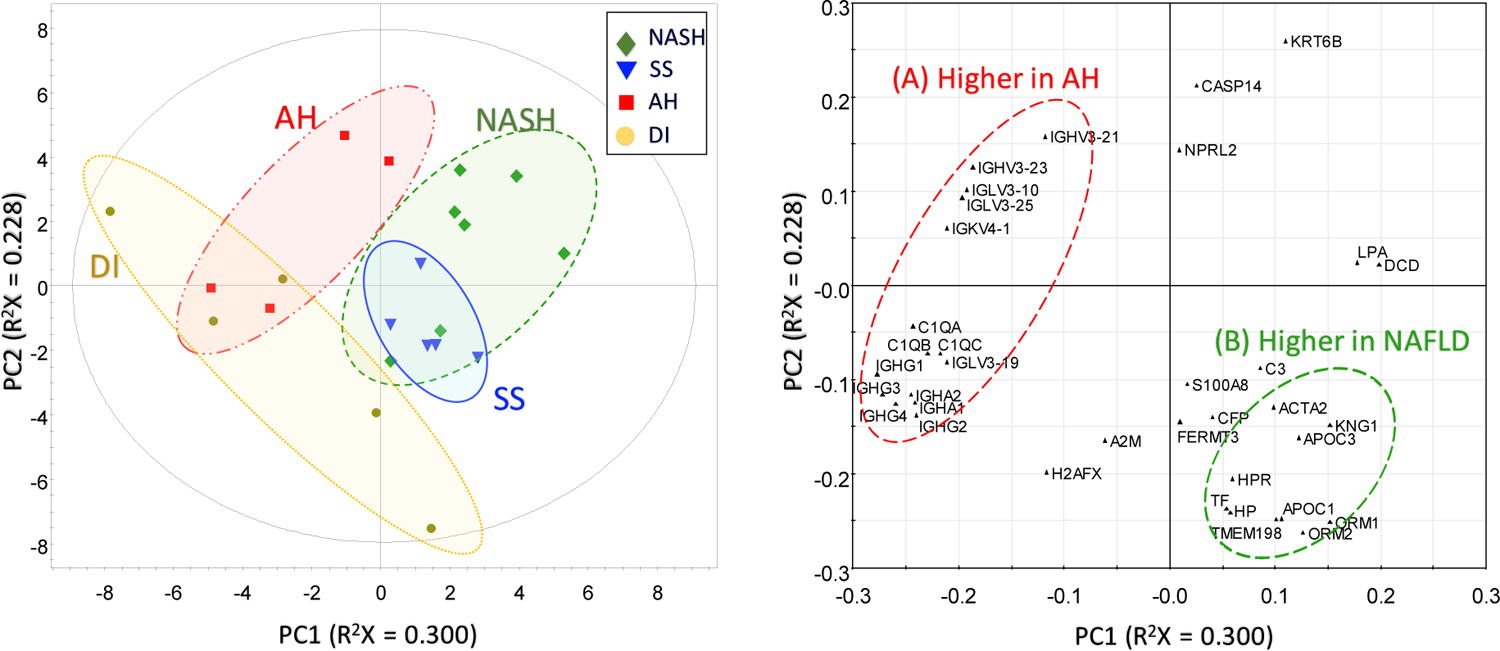
PCA plot (left) and loading plot (right) from multivariate analysis of the filtered dataset, showing classification of the disease types (AH, NASH, and SS).
Official websites use .gov
A
.gov website belongs to an official
government organization in the United States.
Secure .gov websites use HTTPS
A lock (
) or https:// means you've safely
connected to the .gov website. Share sensitive
information only on official, secure websites.
PCA plot (left) and loading plot (right) from multivariate analysis of the filtered dataset, showing classification of the disease types (AH, NASH, and SS).