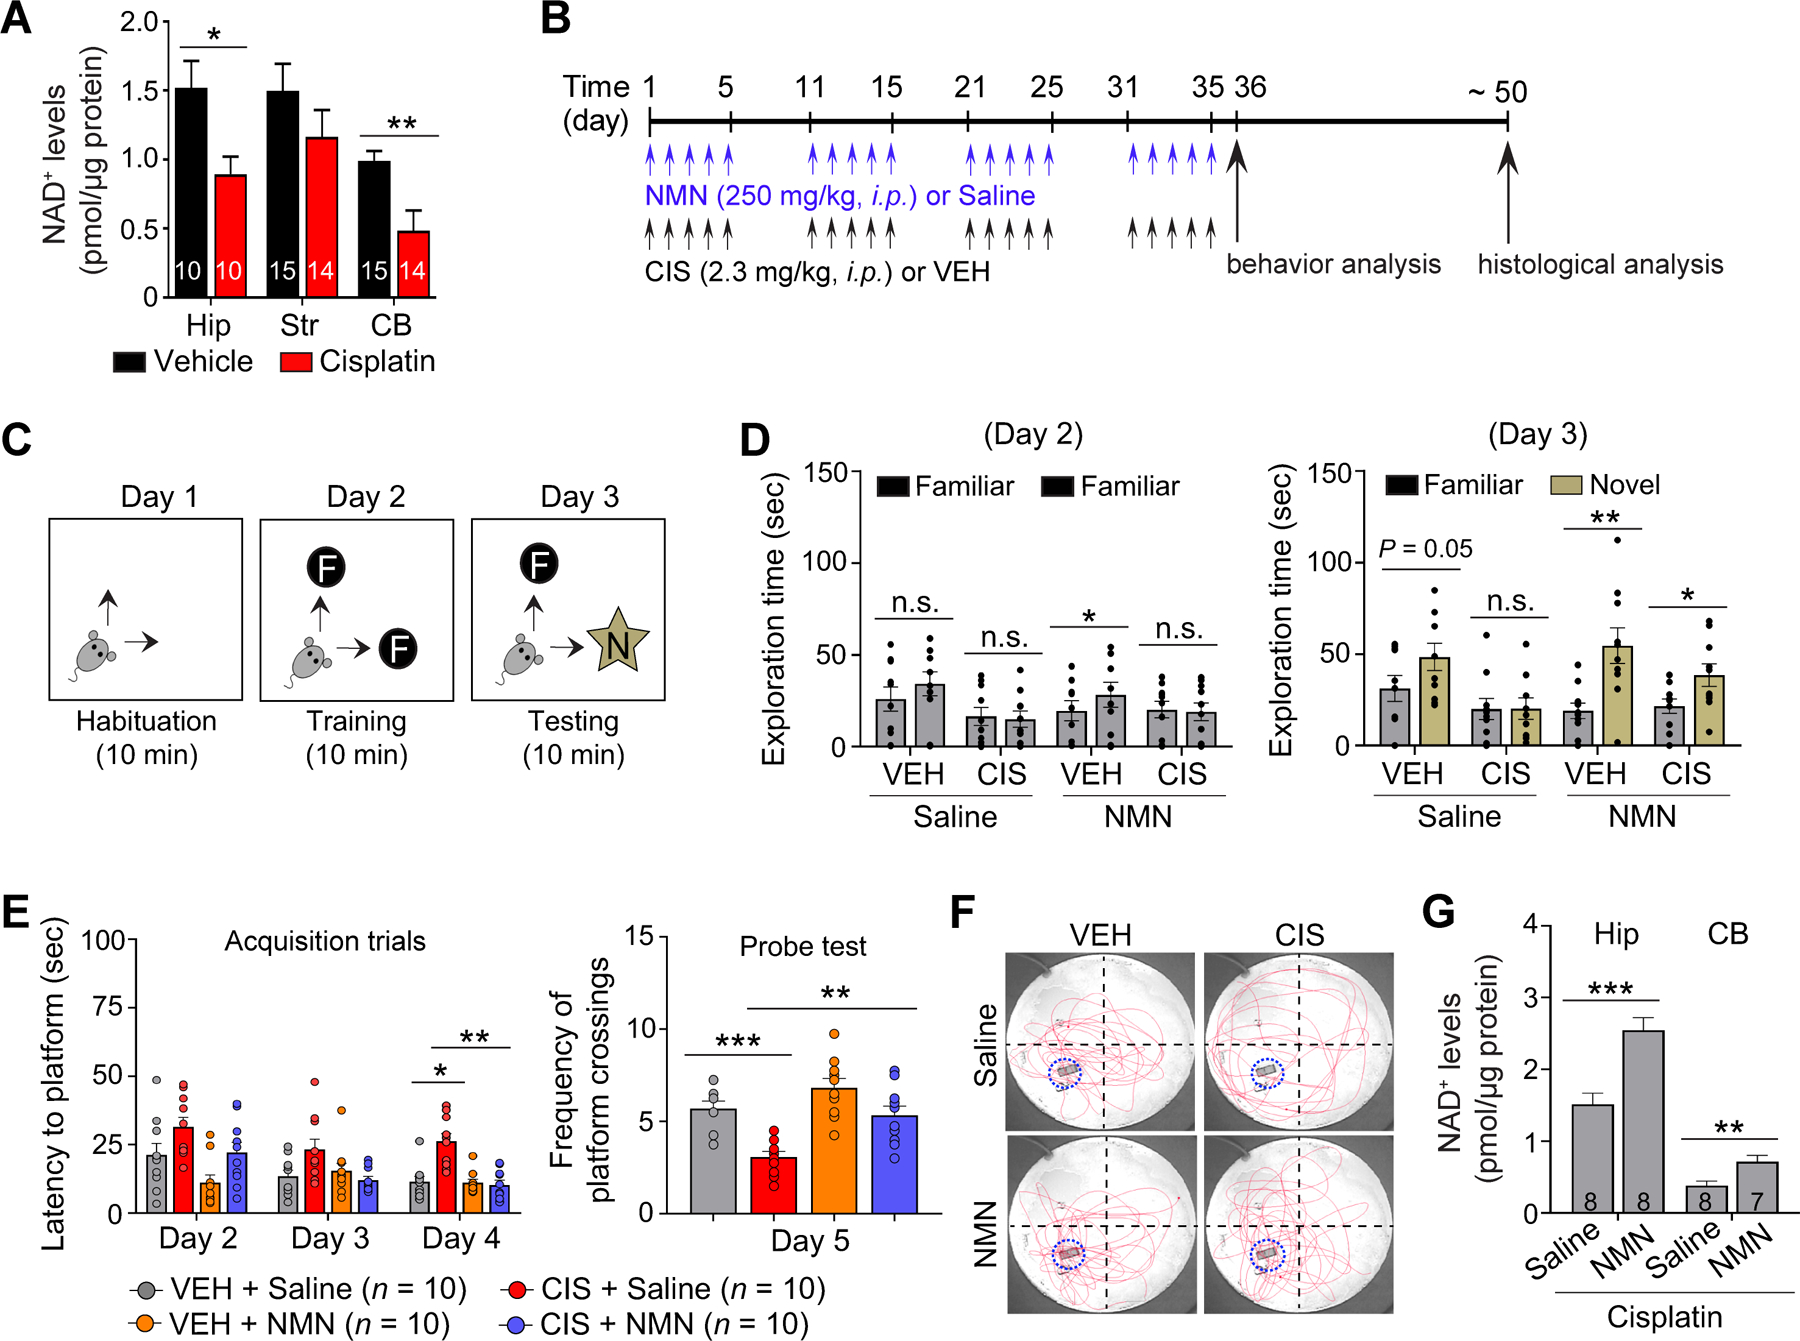
Figure 2. NMN prevents cisplatin-induced impairments in cognitive function.

A, Reduction in cellular NAD+ levels by cisplatin administration in adult mouse hippocampus (Hip), striatum (Str), and cerebellum (CB). B, Schematic diagram of experimental design for NMN and cisplatin administrations, and follow up behavior and cellular analysis presented in Fig. 2, and 3A and B. C, Schematic diagrams of the novel object recognition (NOR) task. D, Left: Time exploring the familiar objects on Day 2. While there was a slight increase in mice treated with NMN alone, there were no major differences detected in time spent exploring the two familiar objects, indicating a lack of location preference. Right: Time exploring the objects in familiar and novel locations on Day 3 was recorded. n = 9–10 mice. E, Average latency to find the hidden platform during training, and average number of target zone crossings where the hidden platform was previously located during the probe test in Morris water maze (MWM) test. F, Representative swimming paths during the probe test (Day 5). G, Increase in cellular NAD+ levels by NMN in combination with cisplatin treatment in the adult mouse hippocampus (Hip) and cerebellum (CB). The number associated with bar graphs indicates the number of mice tested. Circles within each bar in graphs represent an individual mouse. Data represent mean ± SEM. Unpaired, two-tailed Student’s t-test (G) with Welch’s correction (A), paired, two-tailed Student’s t-test (D), and two-way ANOVA followed by Tukey’s post-hoc corrections (F). *: P < 0.05, **: P < 0.01, ***: P < 0.001, n.s.: not significant.
