
Figure 3. NMN prevents cisplatin-induced defects in adult hippocampal neurogenesis in vivo.
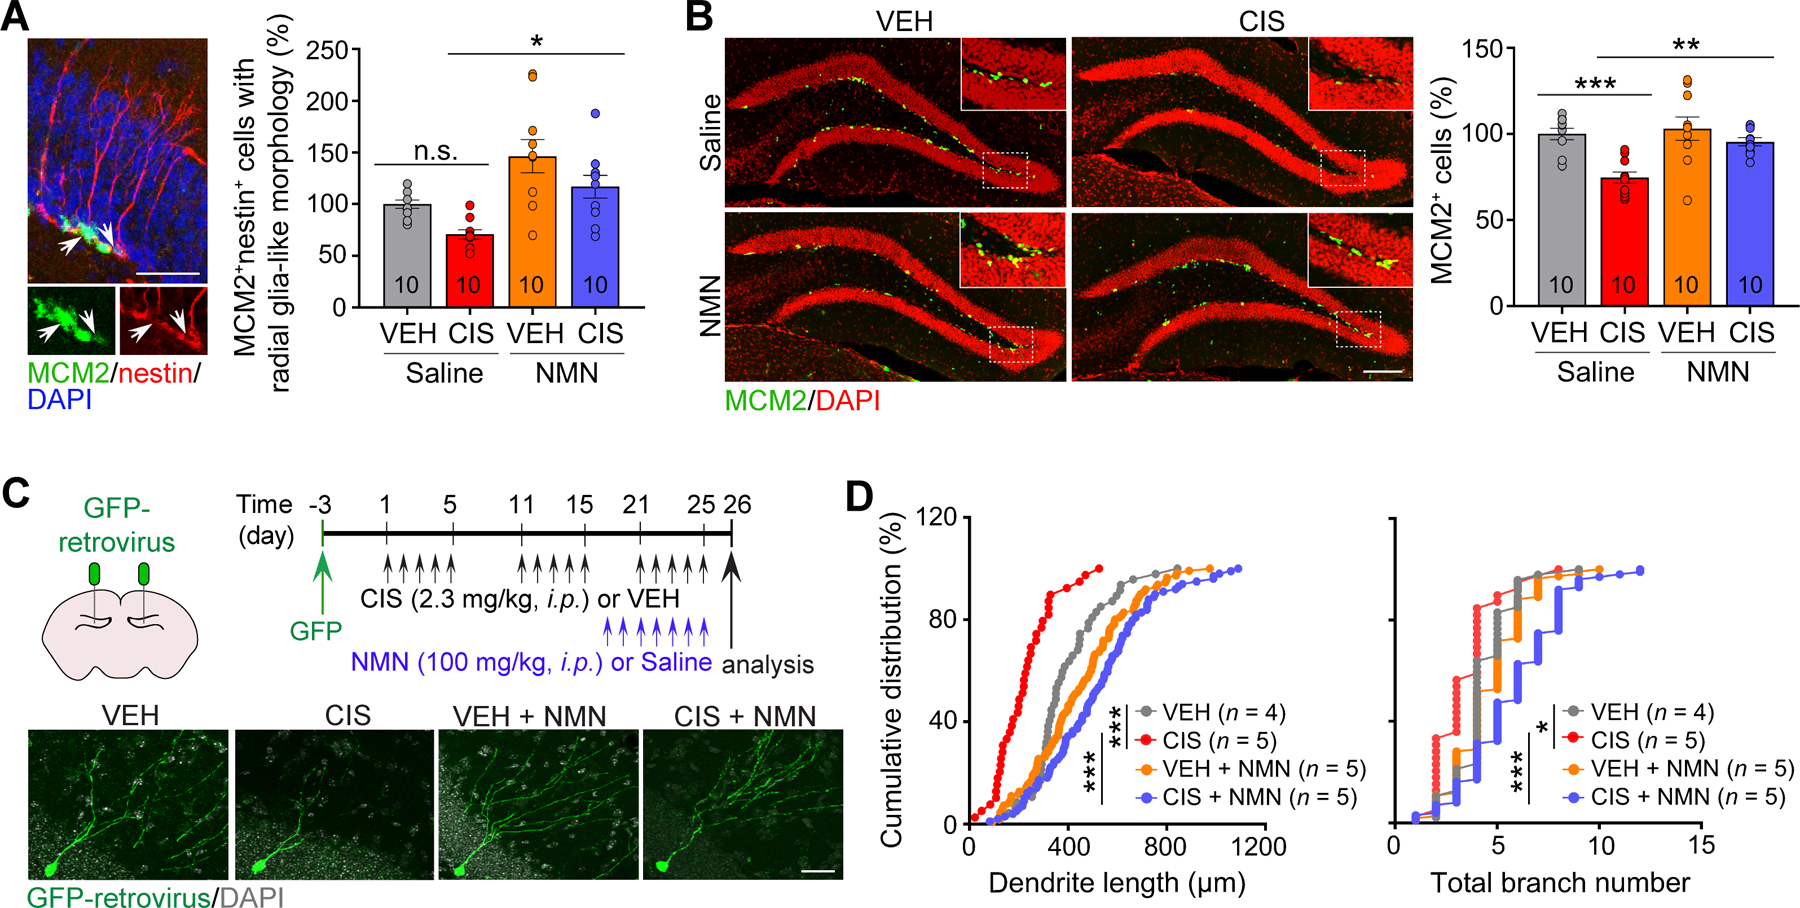
A, Representative images of MCM2 (a proliferating cell marker), nestin (a neural stem cell marker) and DAPI counter staining, and a summary of radial glia-like neural stem cell (RGL) quantification in the adult sub-granular zone (SGZ). Arrows point to MCM2+nestin+ RGLs. Scale bars: 50 μm. B, Representative images of MCM2 and DAPI counter staining, and a summary of intermediate progenitor cell (IPC) quantification in the adult SGZ. Scale bar: 200 μm. The number associated with bar graphs indicates the number of mice tested. Circles within each bar in graphs represent an individual mouse. Data represent mean ± SEM. C, Schematic representation of the intra-hippocampal retroviral injection (Upper left) and experimental design timeline (Upper right). Lower panels: Representative images of GFP+ newborn neurons (green) and DAPI staining (gray). Scale bar: 50 μm. D, Cumulative distribution plots of total dendrite length and branch number of adult-born neurons. Each symbol represents data from a single GFP+ neuron. Two-way ANOVA followed by Tukey’s post-hoc corrections (A and B). Kolmogorov-Smirnov test (D). *: P < 0.05, **: P < 0.01, ***: P < 0.001, n.s.: not significant.