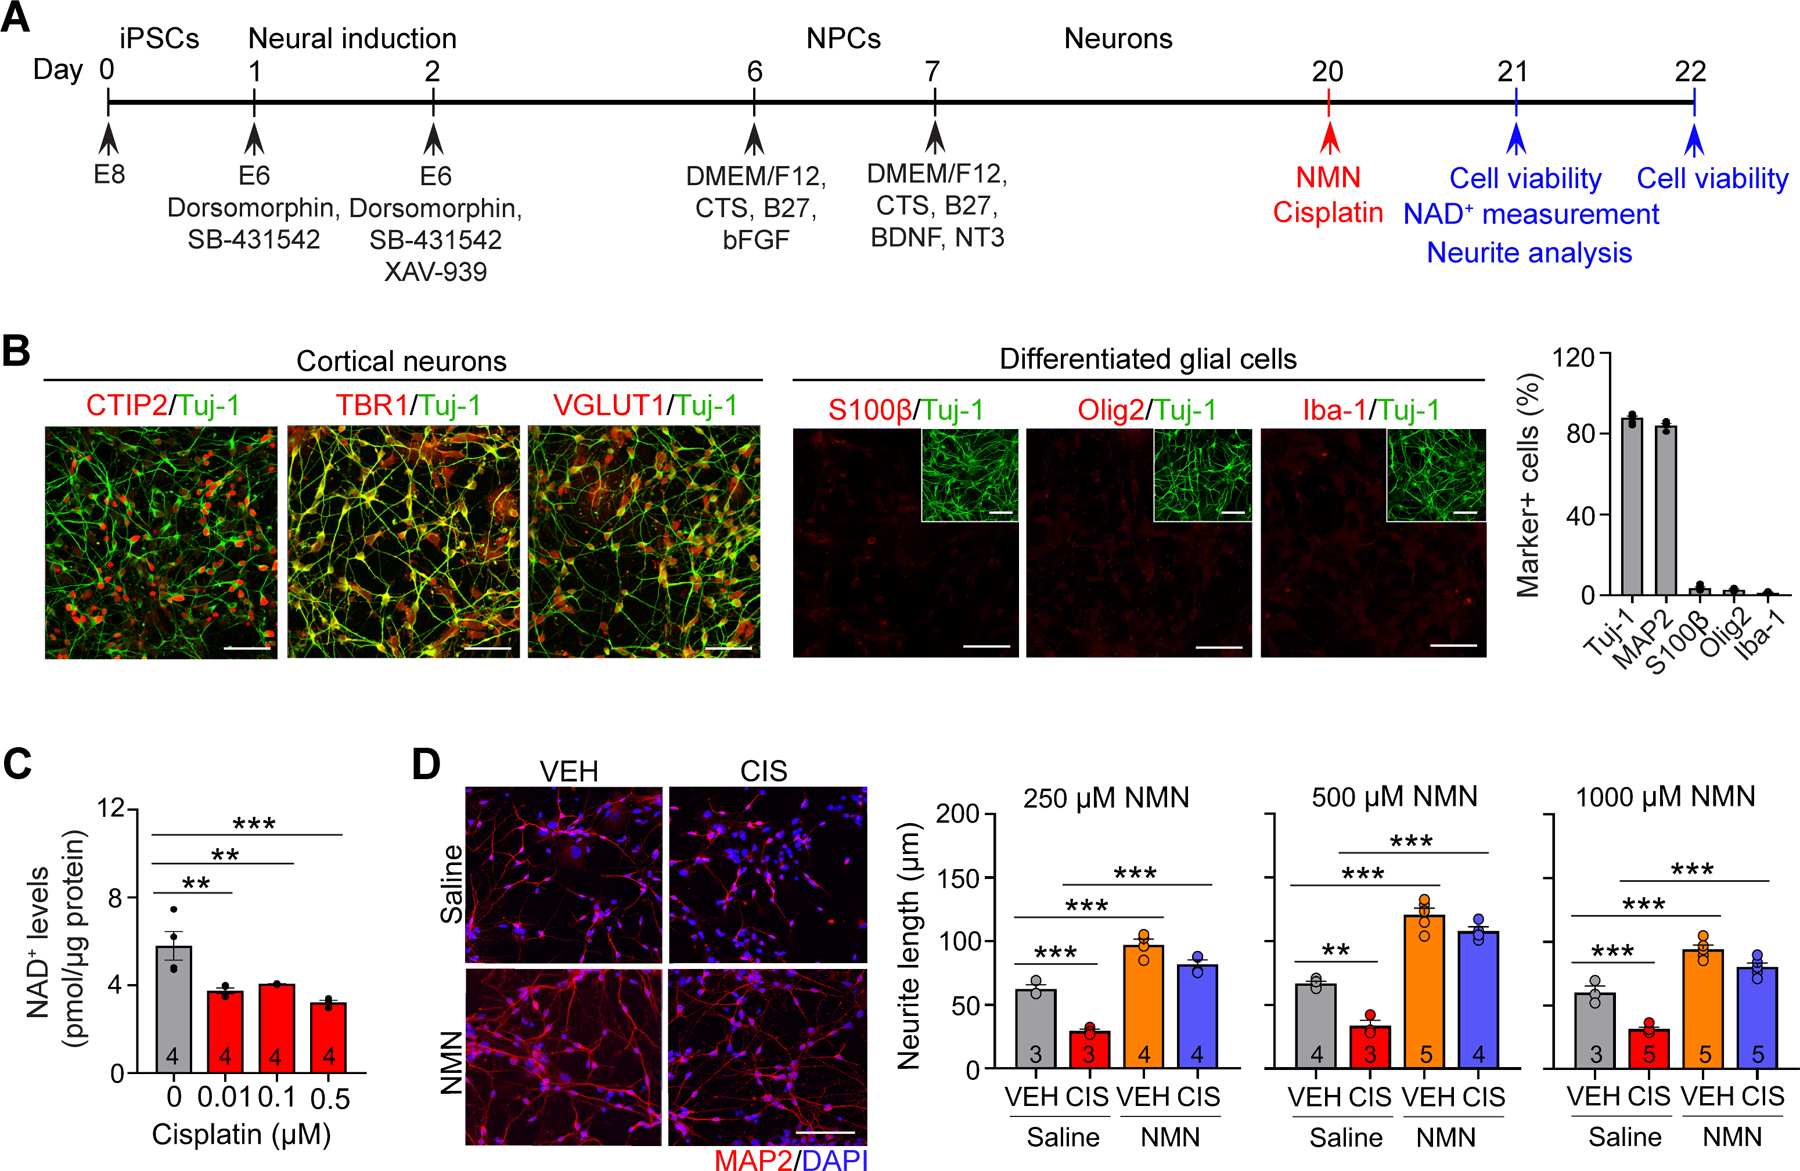
Figure 4. Neuroprotective effects of NMN in cisplatin-induced abnormality in neuronal morphogenesis in human cortical neurons derived from iPSCs in vitro.

A, Schematic diagram of the differentiation procedure. B, Representative confocal images for Tuj-1 (neuron markers), CTIP2 and TBR1 (cortical neuron markers), VGLUT1 (excitatory neuron marker), S100β (astrocyte marker), Olig2 (oligodendrocyte marker) and Iba-1 (microglia marker). Note that the majority of iPSCs were differentiated into cortical excitatory neurons, but not glial cells. All scale bars: 50 μm. C, Reduction in neuronal NAD+ levels by cisplatin administration in human cortical neurons. n = 4 wells/each treatment group. D, Left: Representative images of MAP2 (neuron marker) and DAPI (nuclei marker). Scale bar: 50 μm. Right: Quantification of the neurite outgrowth in each treatment group. Each circle represents an individual well. Data represents mean ± SEM. One-way ANOVA followed by Dunnett’s (C) and two-way ANOVA followed by Tukey’s post-hoc corrections (D). **: P < 0.01, ***: P < 0.001.
