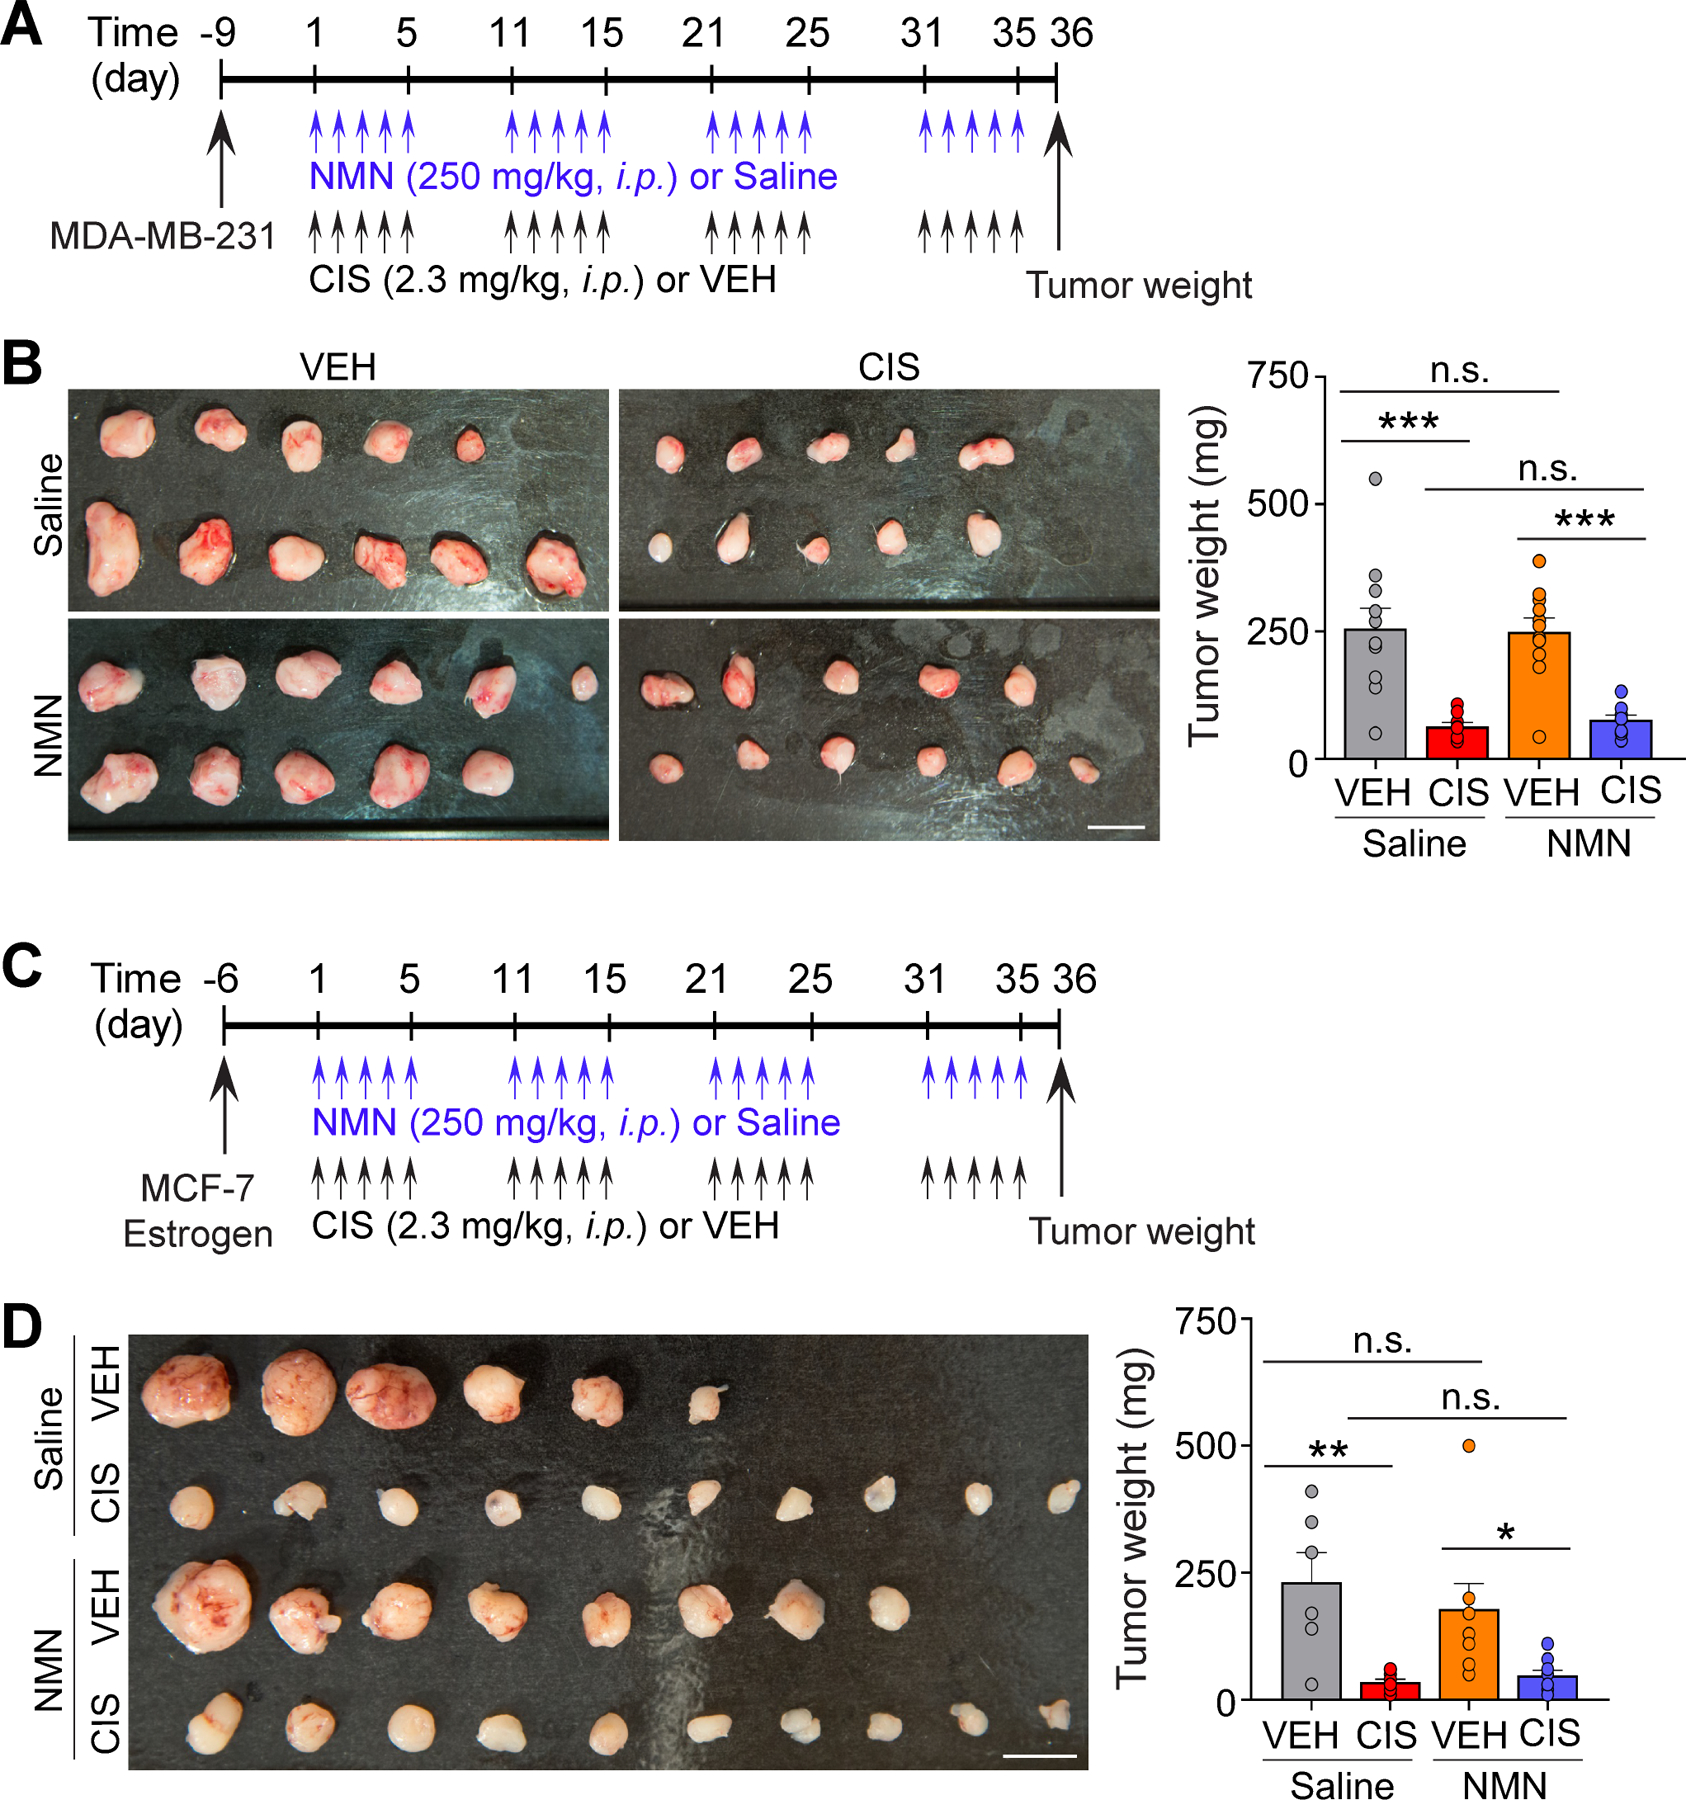
Figure 5. No impact of NMN on tumor growth or anti-tumor activity of cisplatin.

A, Schematic diagram of experimental design. B, MDA-MB-231 xenograft tumors harvested from mice and comparison of tumor weights in each group. C, Diagram of experimental design. n = 10–11 mice. D, MCF-7 xenograft tumors harvested from mice and comparison of tumor weights in each group. Scale bars: 1 cm. Circles within each bar in graphs represent an individual mouse. n = 6–10 mice. Data represents mean ± SEM. Two-way ANOVA followed by Tukey’s post-hoc corrections (B and D). *: P < 0.05, **: P < 0.01, ***: P < 0.001, n.s.: not significant.
