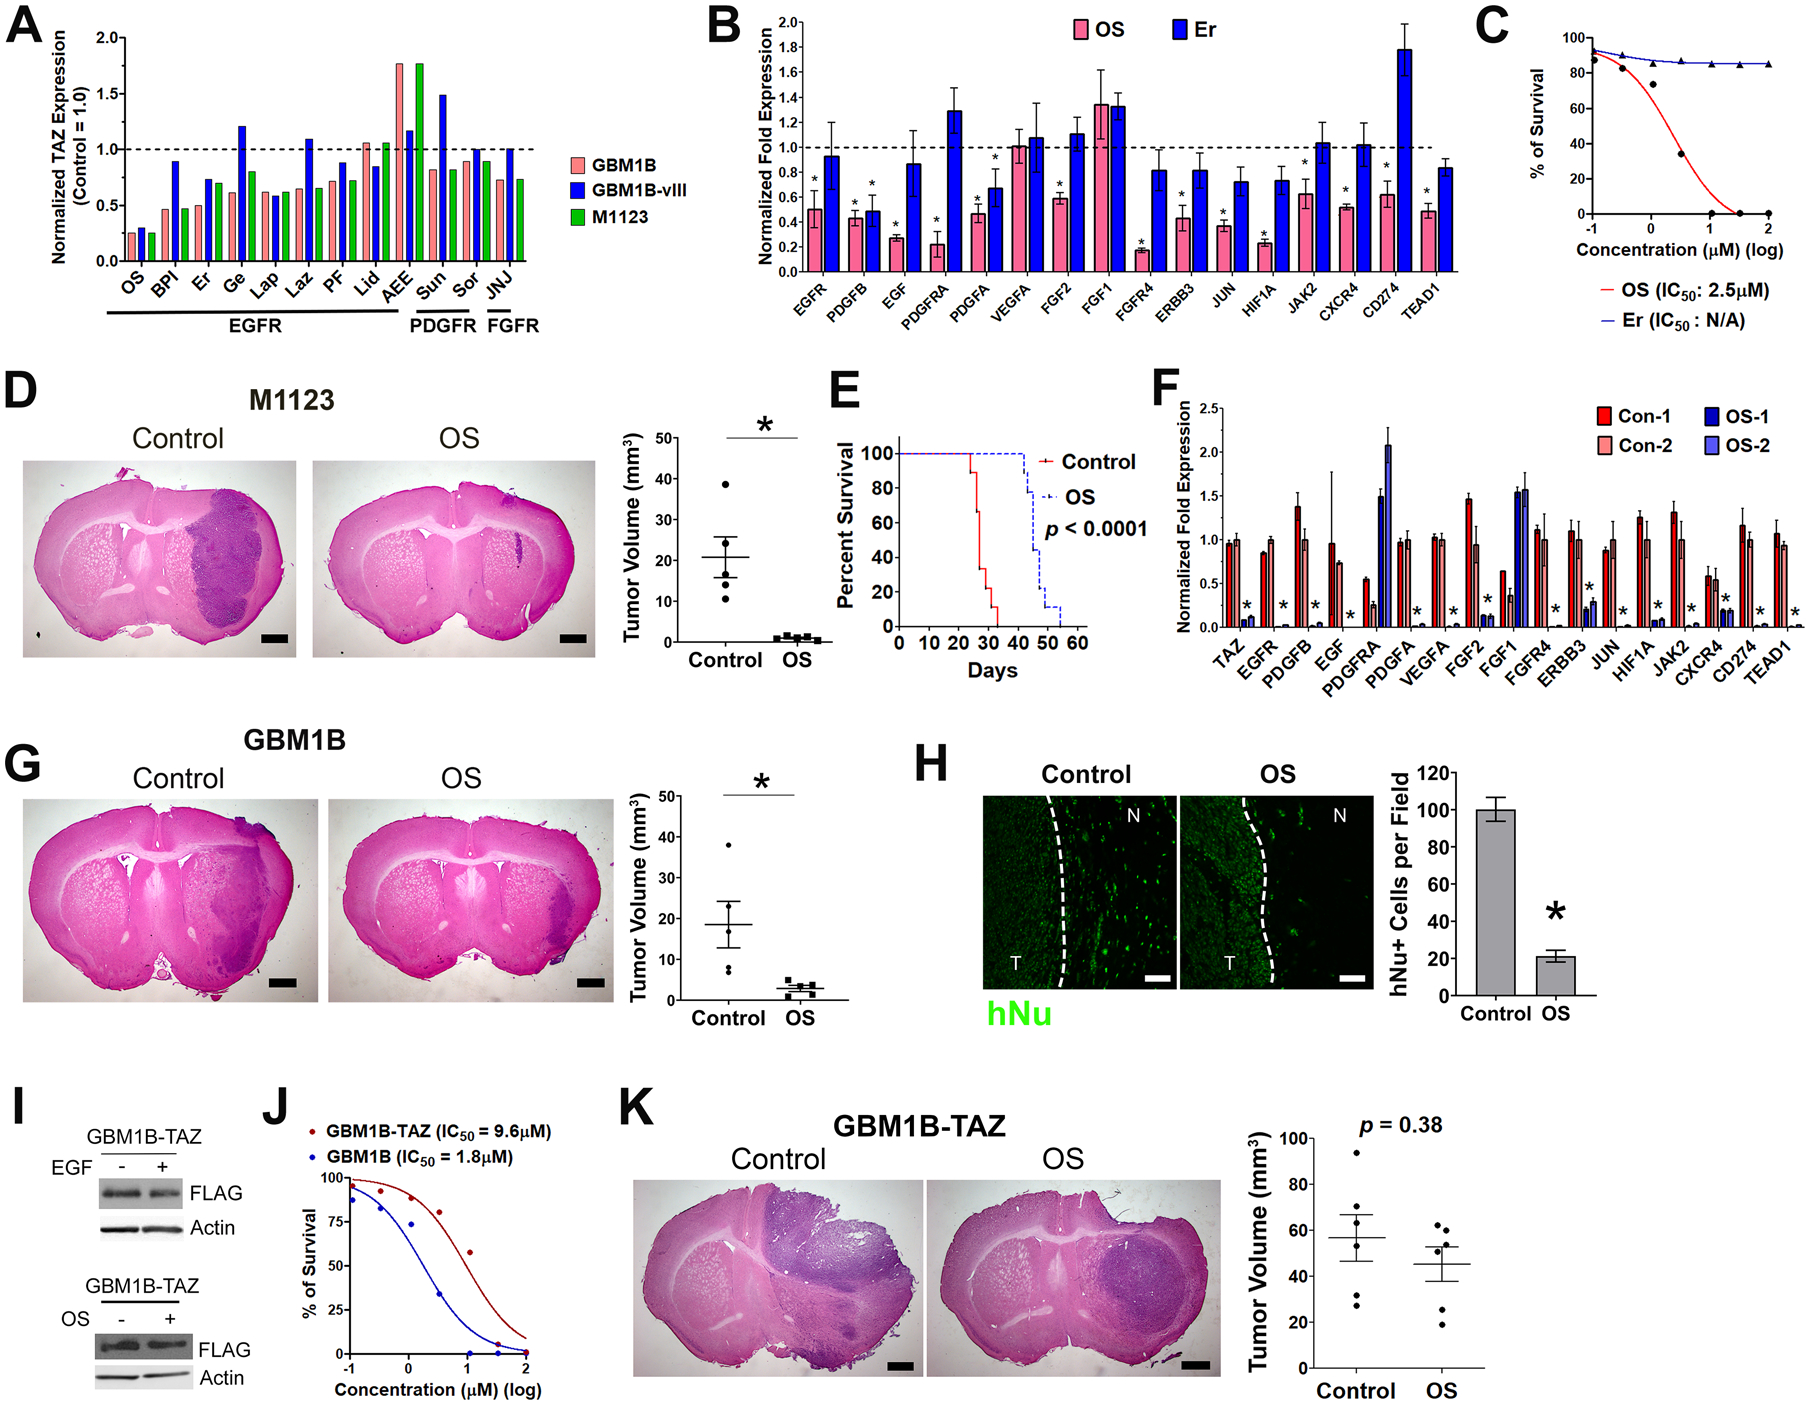
Figure 7: Pharmacological TAZ inhibition by the EGFR inhibitor osimertinib (OS).

A: Three GBM cell lines were pre-treated with 12 RTK inhibitors as marked for 16 hours in growth factor-depleted medium. After 4-hour EGF stimulation, total protein lysates were subjected to TAZ western blotting. Protein fold expressions normalized to β-Actin were quantified and normalized to control cells without compound treatment (dash line: TAZ level in compound-untreated cells).
B: GBM1B cells with +/− OS (0.5 μM) and Er (10 μM) treatment as prepared in A were subjected to qRT-PCR for TAZ-Up genes (compound-untreated control = 1.0 (dash line); *: p < 0.01 compared to the untreated control).
C: Alamar blue cell proliferation assay in GBM1B cells with OS and Er treatment.
D-F: Coronal brain sections (20 μm, with H&E staining) were used for tumor size quantification of M1123 xenografts with +/− OS treatment (D, n=5, post-implantation day 15, Bar = 0.5 mm). This OS treatment also extended the survival of mice bearing M1123 xenografts (n = 9, p < 0.0001, log-rank test). Tumor specimens (n=2 for each group) were microdissected from regions close to injection needle tracts to measure TAZ and TAZ-Up gene expression by qRT-PCR (F, n=2).
G and H: Coronal brain sections (20 μm, with H&E staining) were prepared for tumor size quantification of GBM1B xenografts with +/− OS treatment (F, n=5, post-implantation day 82, Bar = 0.5 mm). hNu immunostaining detected tumor cells in the invading tumor edge (dash line) for quantification (G, Bar = 50 μm)
I: GBM1B-TAZ cells were depleted of growth factors for 16 hours and treated with +/− EGF for 4 hours (Top panel). GBM1B-TAZ cells have +/− OS treatment for 16 hours in growth factor-depleted medium followed by 4-hour EGF stimulation (Bottom panel). Total protein lysates were subjected to TAZ western blotting.
J: Alamar blue cell proliferation assay in GBM1B and GBM1B-TAZ cells with OS treatment.
K: The size of GBM1B-TAZ xenografts with +/− OS treatment was quantified using coronal brain sections (20 μm, with H&E staining, n=6, post-implantation day 50, Bar = 0.5 mm, p = 0.38).
Data are represented as mean ± SEM (*: p < 0.01).
