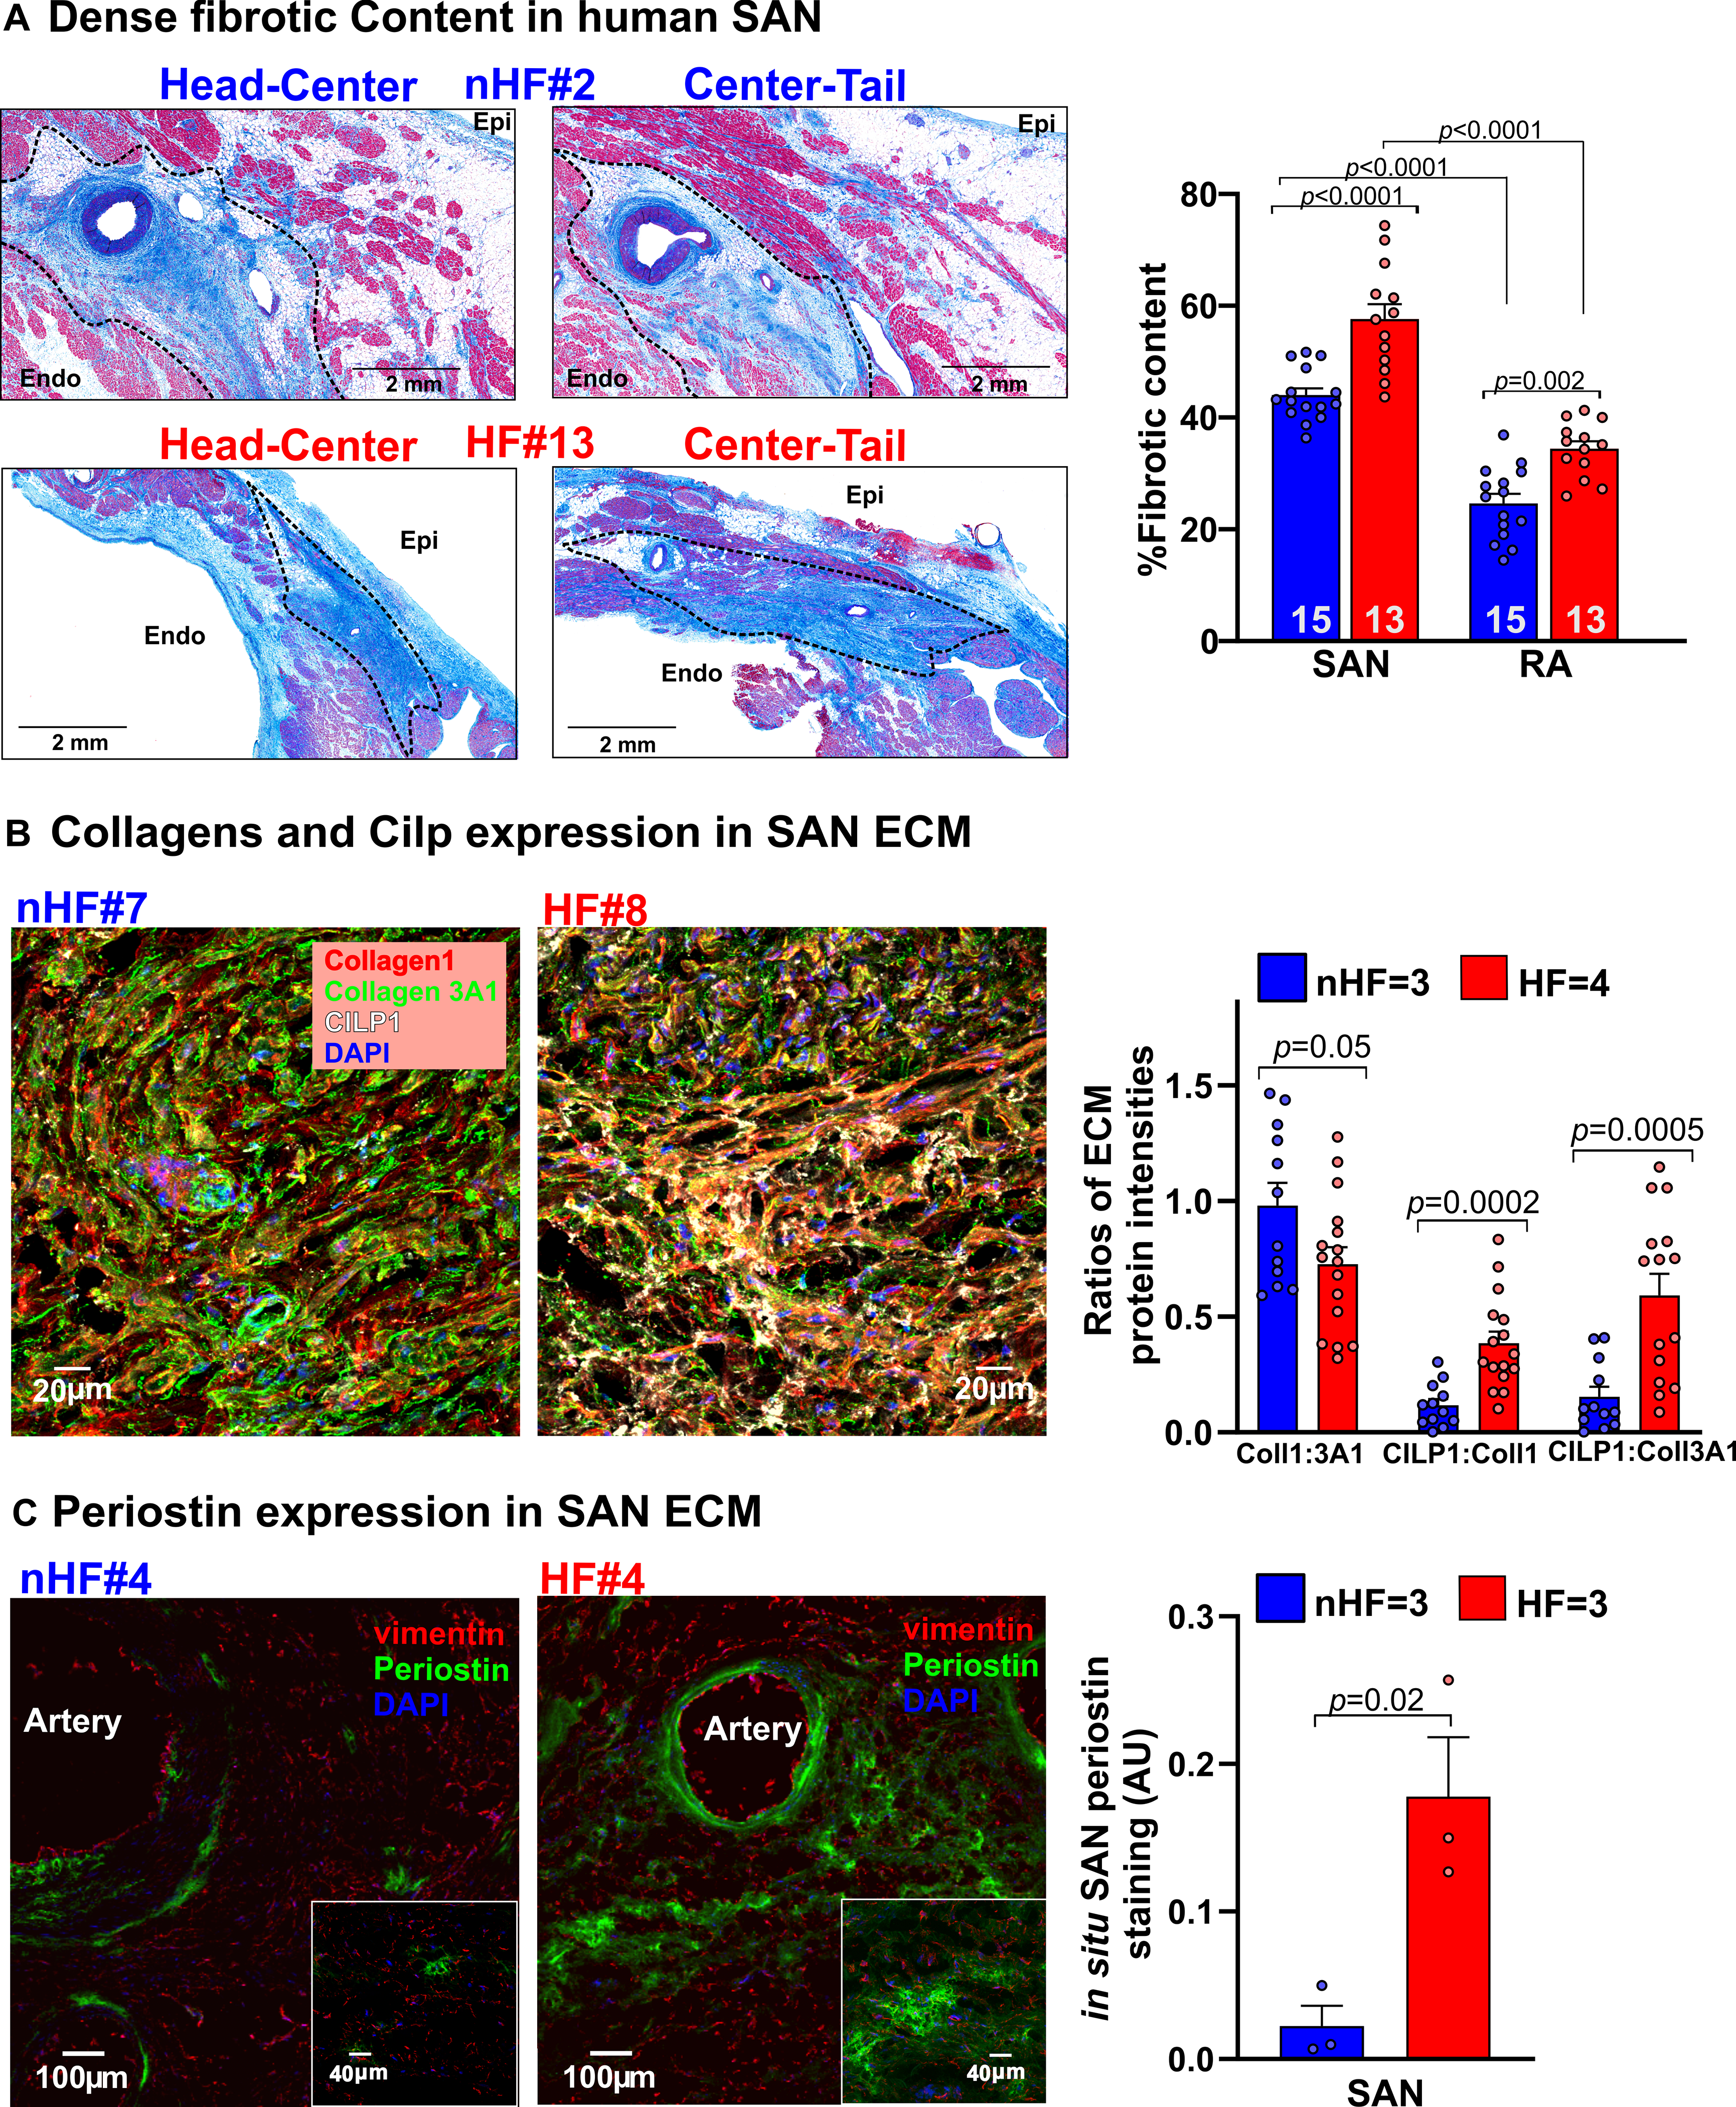
Figure 2: Quantification of dense connective tissue and composition of extra cellular matrix (ECM) in human sinoatrial node (SAN).

A, Left, representative images showing dense connective tissue and fibrosis (blue) identified in Masson’s Trichrome stained paraffin embedded human non-failing (nHF) and failing (HF) SAN sections respectively. Right, quantification of dense connective tissue from sections of SAN head, center and tail compartments. (Hearts: nHF (n=15) and HF (n=13); each dot is an average of at least 3 measurements per SAN and RA). B, Left, representative images of ECM proteins collagens 1 (red), 3A1 (green) and cartilage intermediate layer protein 1 (CILP1) (white) staining in nHF and HF SAN cryosections (also see Figure IA in the Data Supplement). Right, summary data of their ratios (Hearts: nHF (n=3) and HF (n=4); each dot is an average of measurements from 4 fields-of-view per SAN) C, Left, nHF and HF SAN cryosections stained with vimentin (red) and periostin (green). Cell nuclei were stained with Dapi (blue). Right, summary data of periostin staining density ((nHF (n=3) and HF (n=3); each dot represents measurement from each SAN). (All data analyzed with ANOVA (two or multiple group comparison as applicable) and expressed as mean±SEM, (p<0.05)). CT- crista terminalis; IAS- interatrial septum; Epi/Endo-epi/endocardial; SAN-sinoatrial node; RA-right atria.
