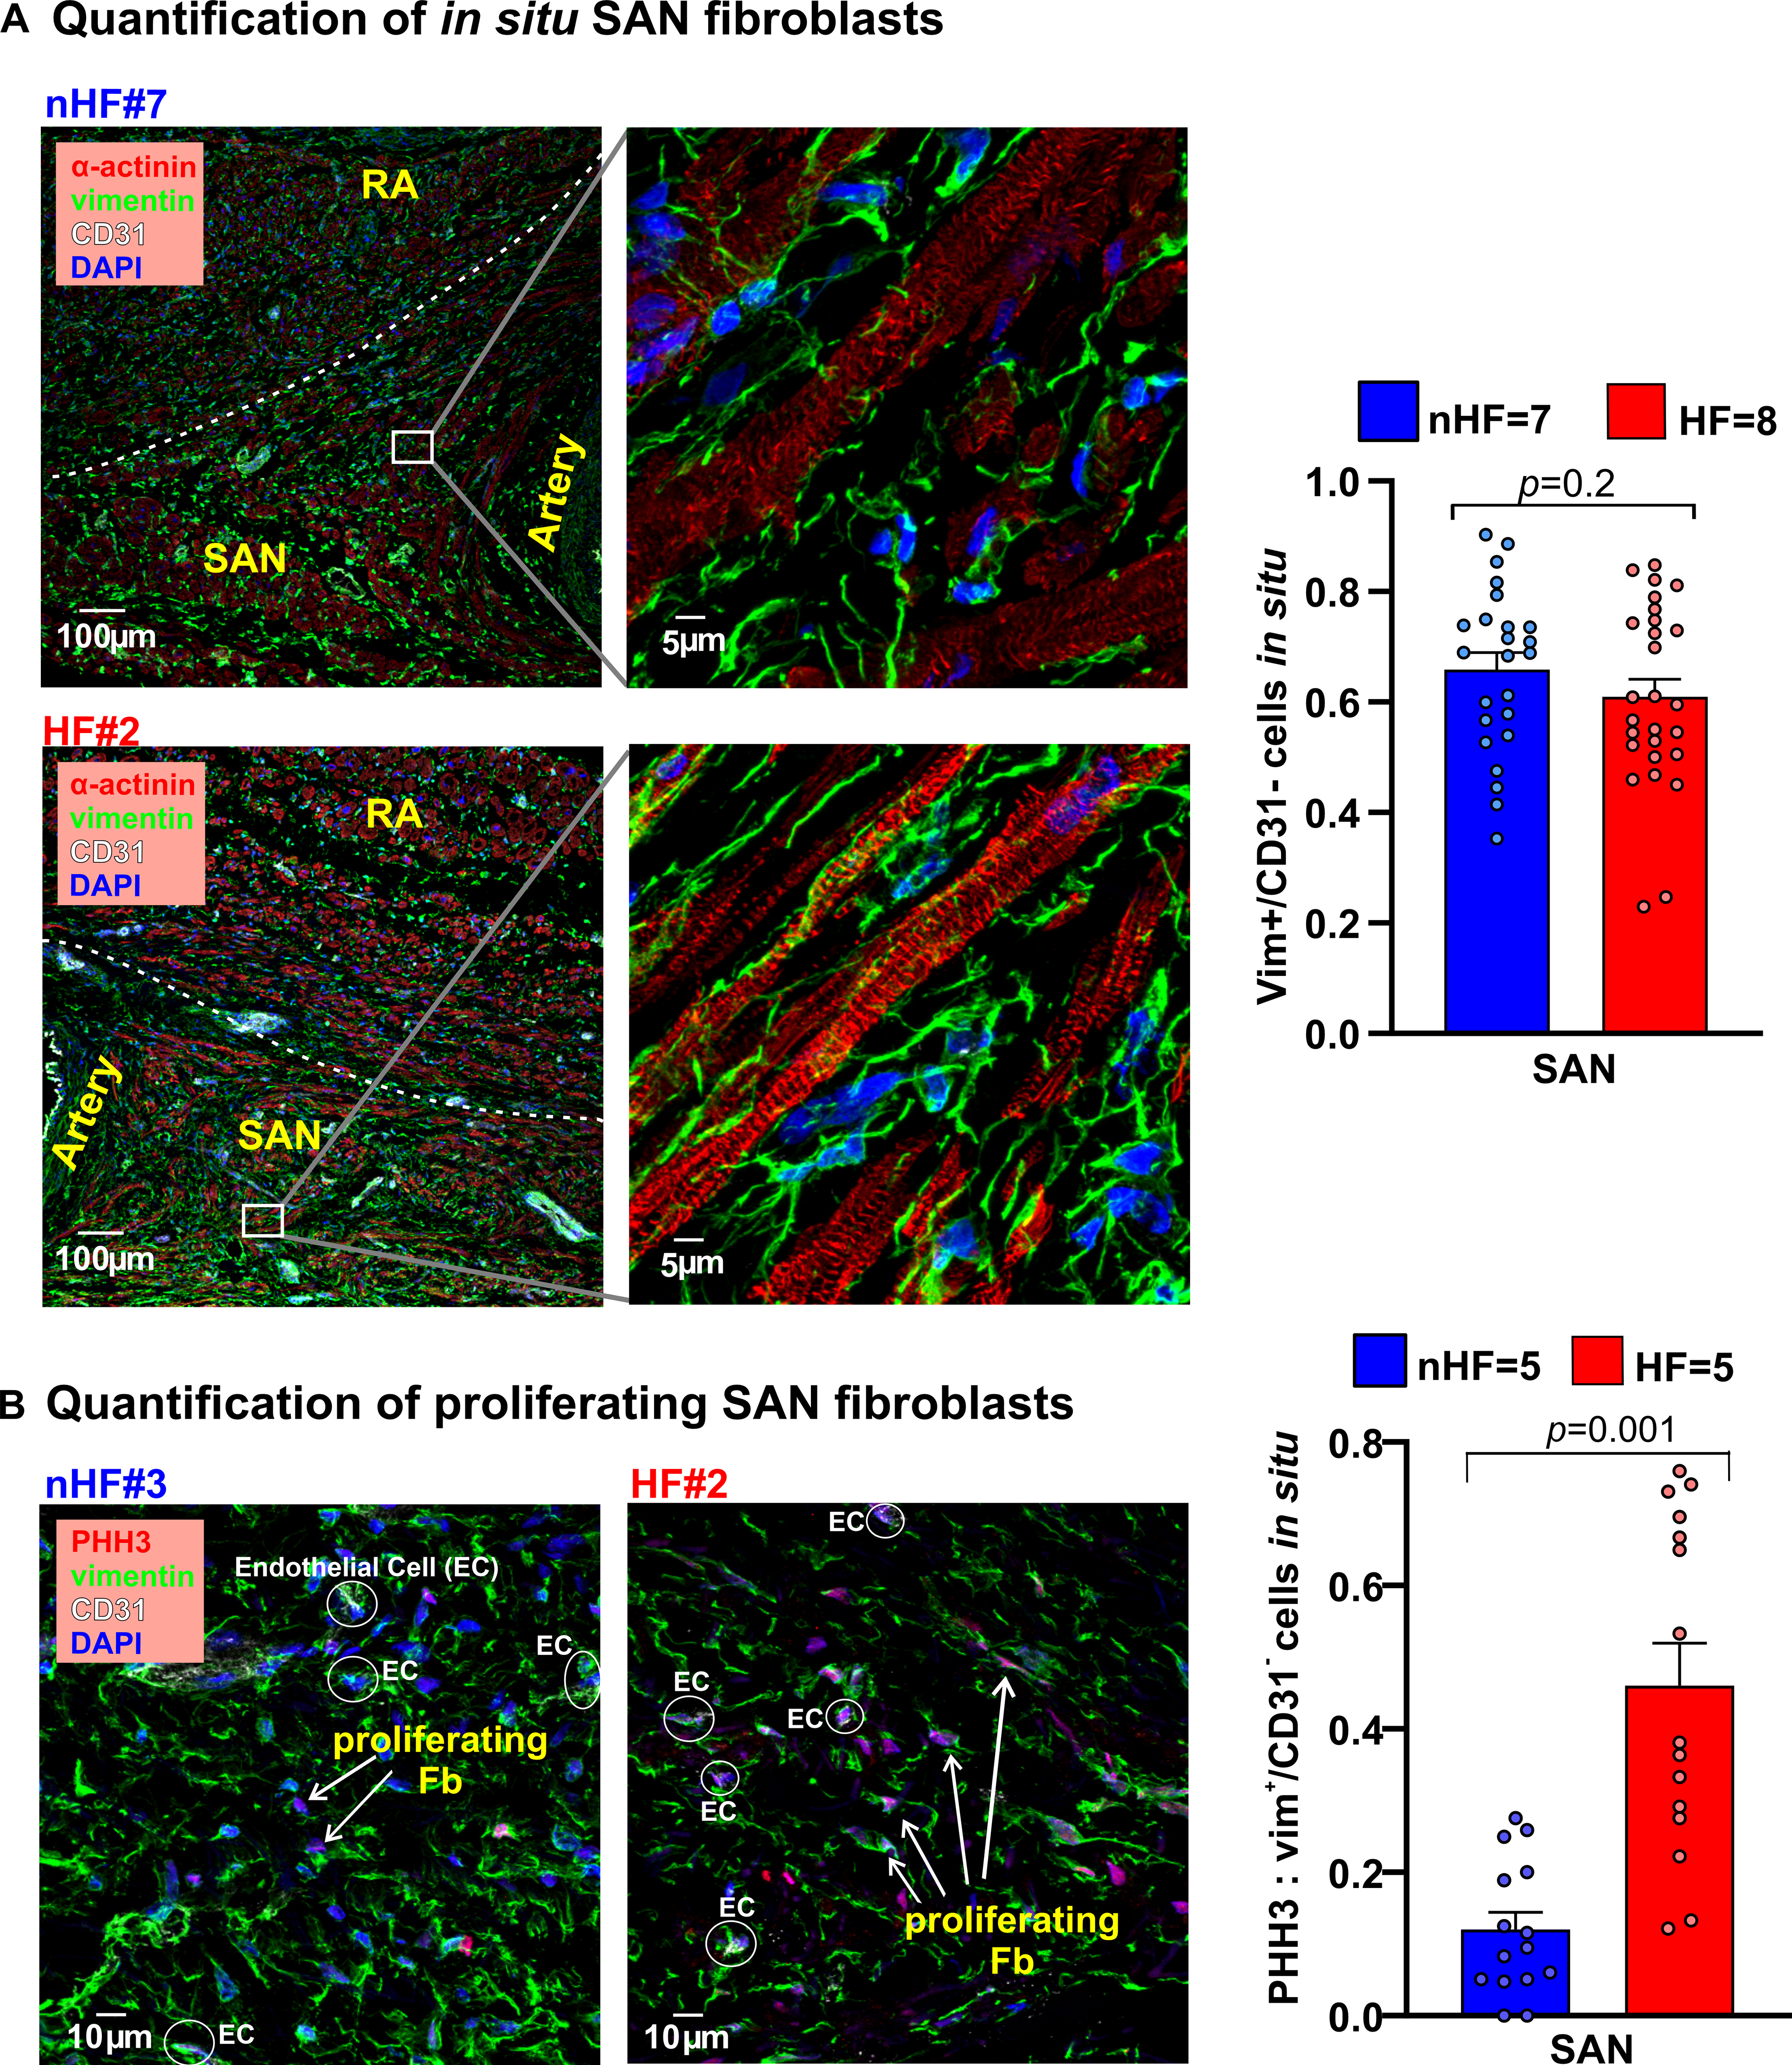
Figure 3: Composition of fibroblasts in nHF and HF SAN.

A, Left, Fibroblasts in the non-failing (nHF) and failing (HF) SAN stained in cryosections with vimentin (green), cardiomyocytes with α-actinin (red), and Dapi (blue); right, summary data of vimentin positive cells relative to all cells (Hearts: nHF (n=7) and HF (n=8); each dot is an average of measurements from 3–4 fields-of-view per SAN). B, Left, sections from nHF and HF SANs stained for vimentin (green), phosphorylated histone3 (PHH3; red), CD31(white) and blue (Dapi); right, summary of proliferating fibroblasts quantified as a ratio of PHH3 positive cells to vimentin+/CD31- cells (Hearts: nHF (n=5) and HF (n=5); each dot is an average of measurements from 3 fields-of-view per SAN). (All data analyzed with ANOVA and expressed as mean±SEM, (p<0.05)).SAN-sinoatrial node; RA-right atria.
