
Figure 5: Whole transcriptomic profiles of human SAN fibroblasts.
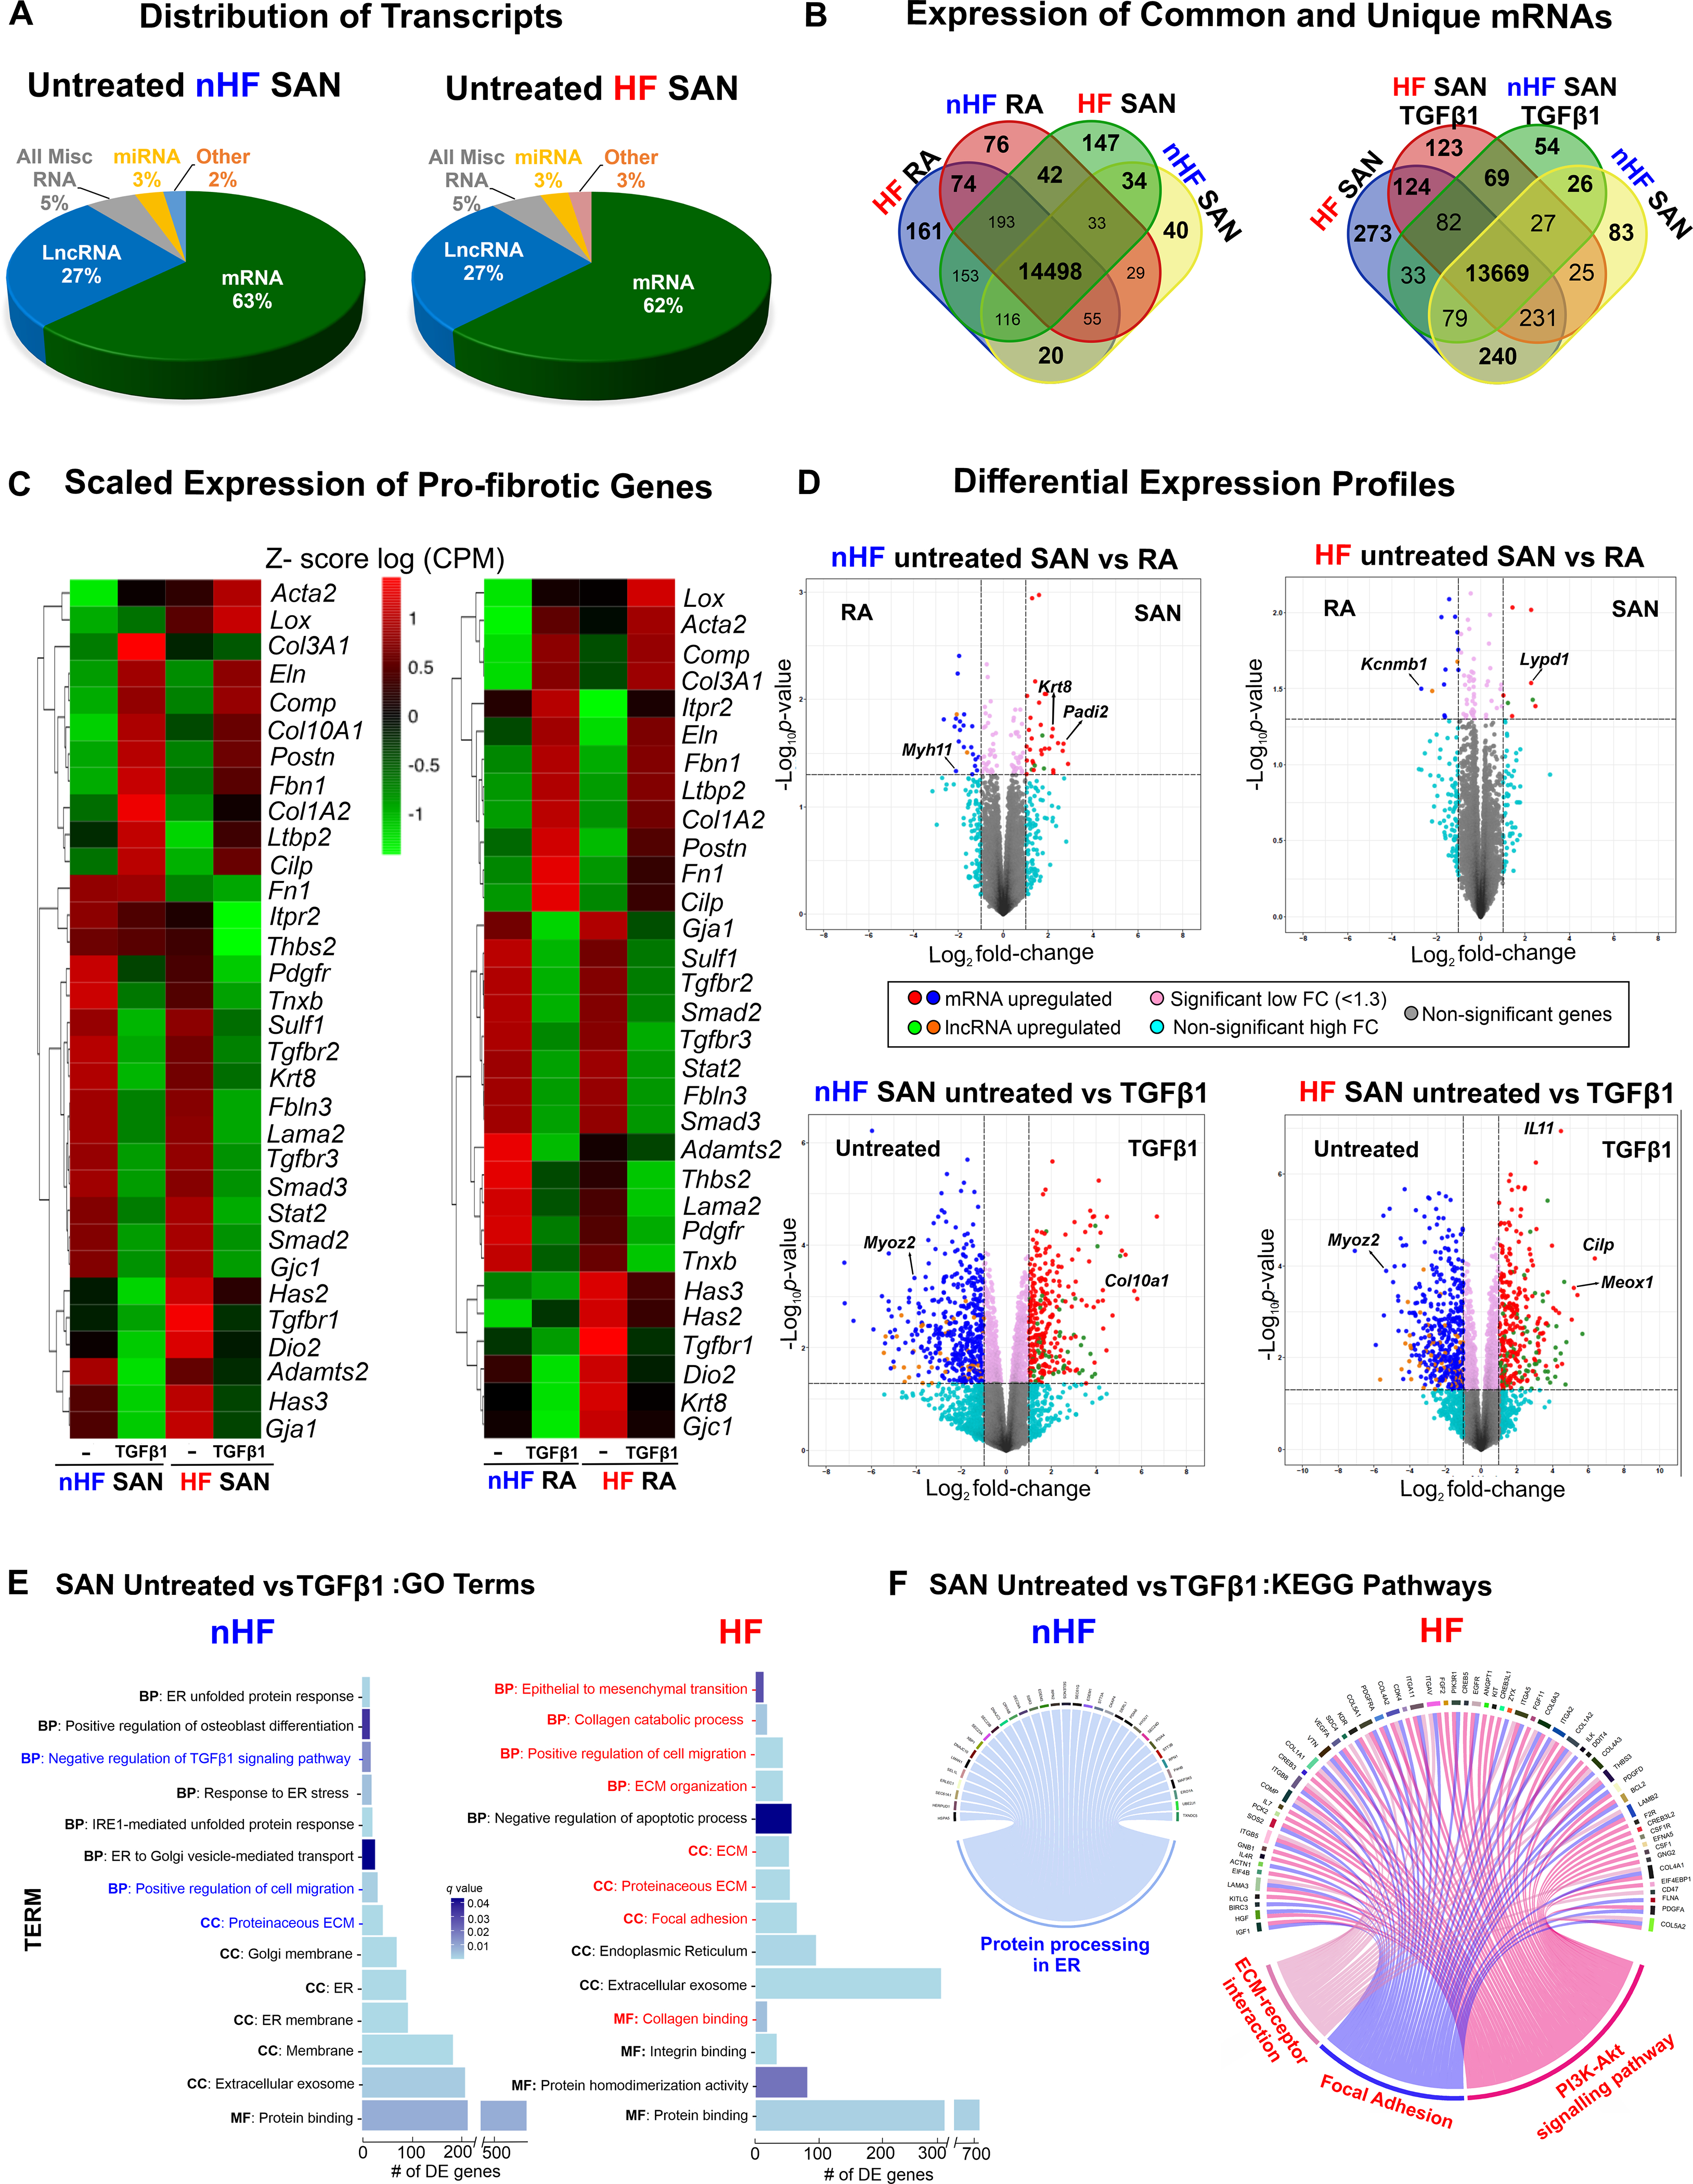
A, Distribution of major coding and non-coding transcript groups detected across untreated non-failing (nHF) and failing (HF) SAN fibroblasts. B, Venn diagrams showing unique and shared mRNAs between SAN shown comparison groups. C, Heatmaps showing scaled expression levels of selected pro-fibrotic genes in nHF and HF SAN vs RA ±TGFβ1 groups. D, Volcano plots of mRNAs and long non-coding RNAs (lncRNA) differentially expressed between groups shown at p <0.05 and log2fold change >1.3. E, Differentially expressed genes (q<0.05) enriched within three gene ontology analyses terms (MF-molecular function, BP-biological process, CC-cellular component) in nHF and HF untreated vs TGFβ1 fibroblasts (selected terms are presented) and F, Circos plots showing differentially expressed genes (p<0.05) associated with KEGG pathways in nHF and HF untreated vs TGFβ1 SAN fibroblasts (nHF=3; HF=4). Magnified images of GO and KEGG plots are presented in Figure IX in the Data Supplement (ER- endoplasmic reticulum; ECM-Extracellular matrix; SAN-Sinoatrial node; RA-right atria; TGFβ1-Transforming Growth Factor beta 1; mRNA- coding messenger RNA; Misc-miscellaneous; miRNA- microRNA).