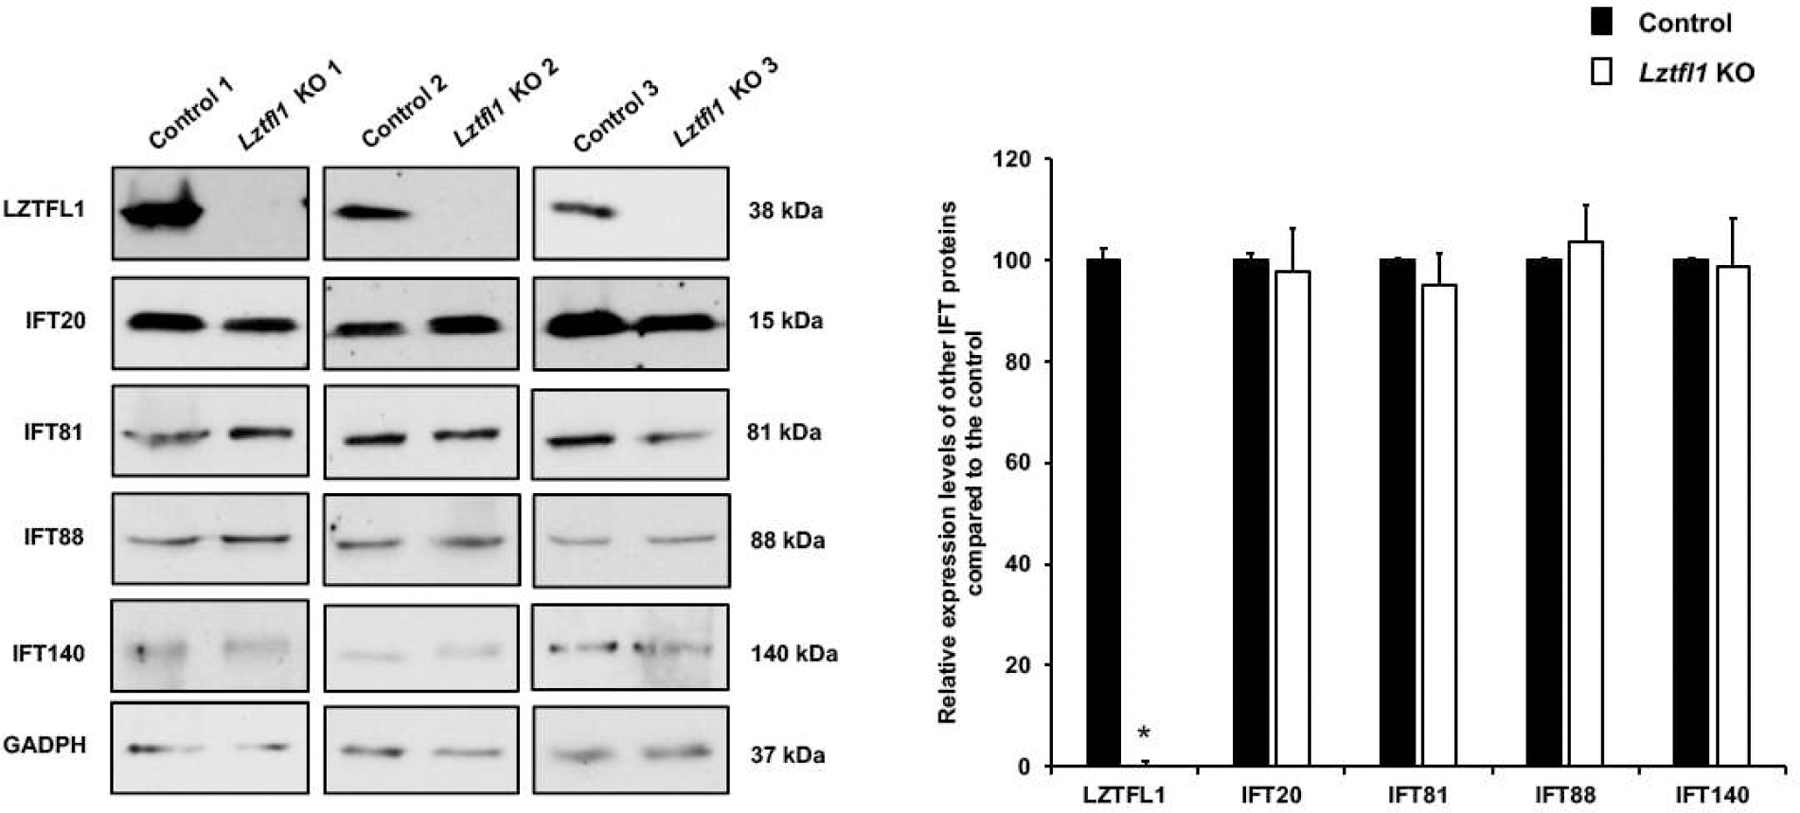
Figure 8. Expression levels of IFT20, 81, 88 and 140 proteins in the control and Lztfl1KO mice.

Left: Examination of IFT20, IFT81, IFT88 and IFT140 proteins expression levels in the control (wild type and heterozygote) and global Lztfl1 KO mice by Western blot. Between the control and mutant mice, the expression levels of all selective IFT proteins showed no significant change. Right: Quantitative analysis of selective IFT proteins expression. Statistically significant differences: *p < 0.05.
