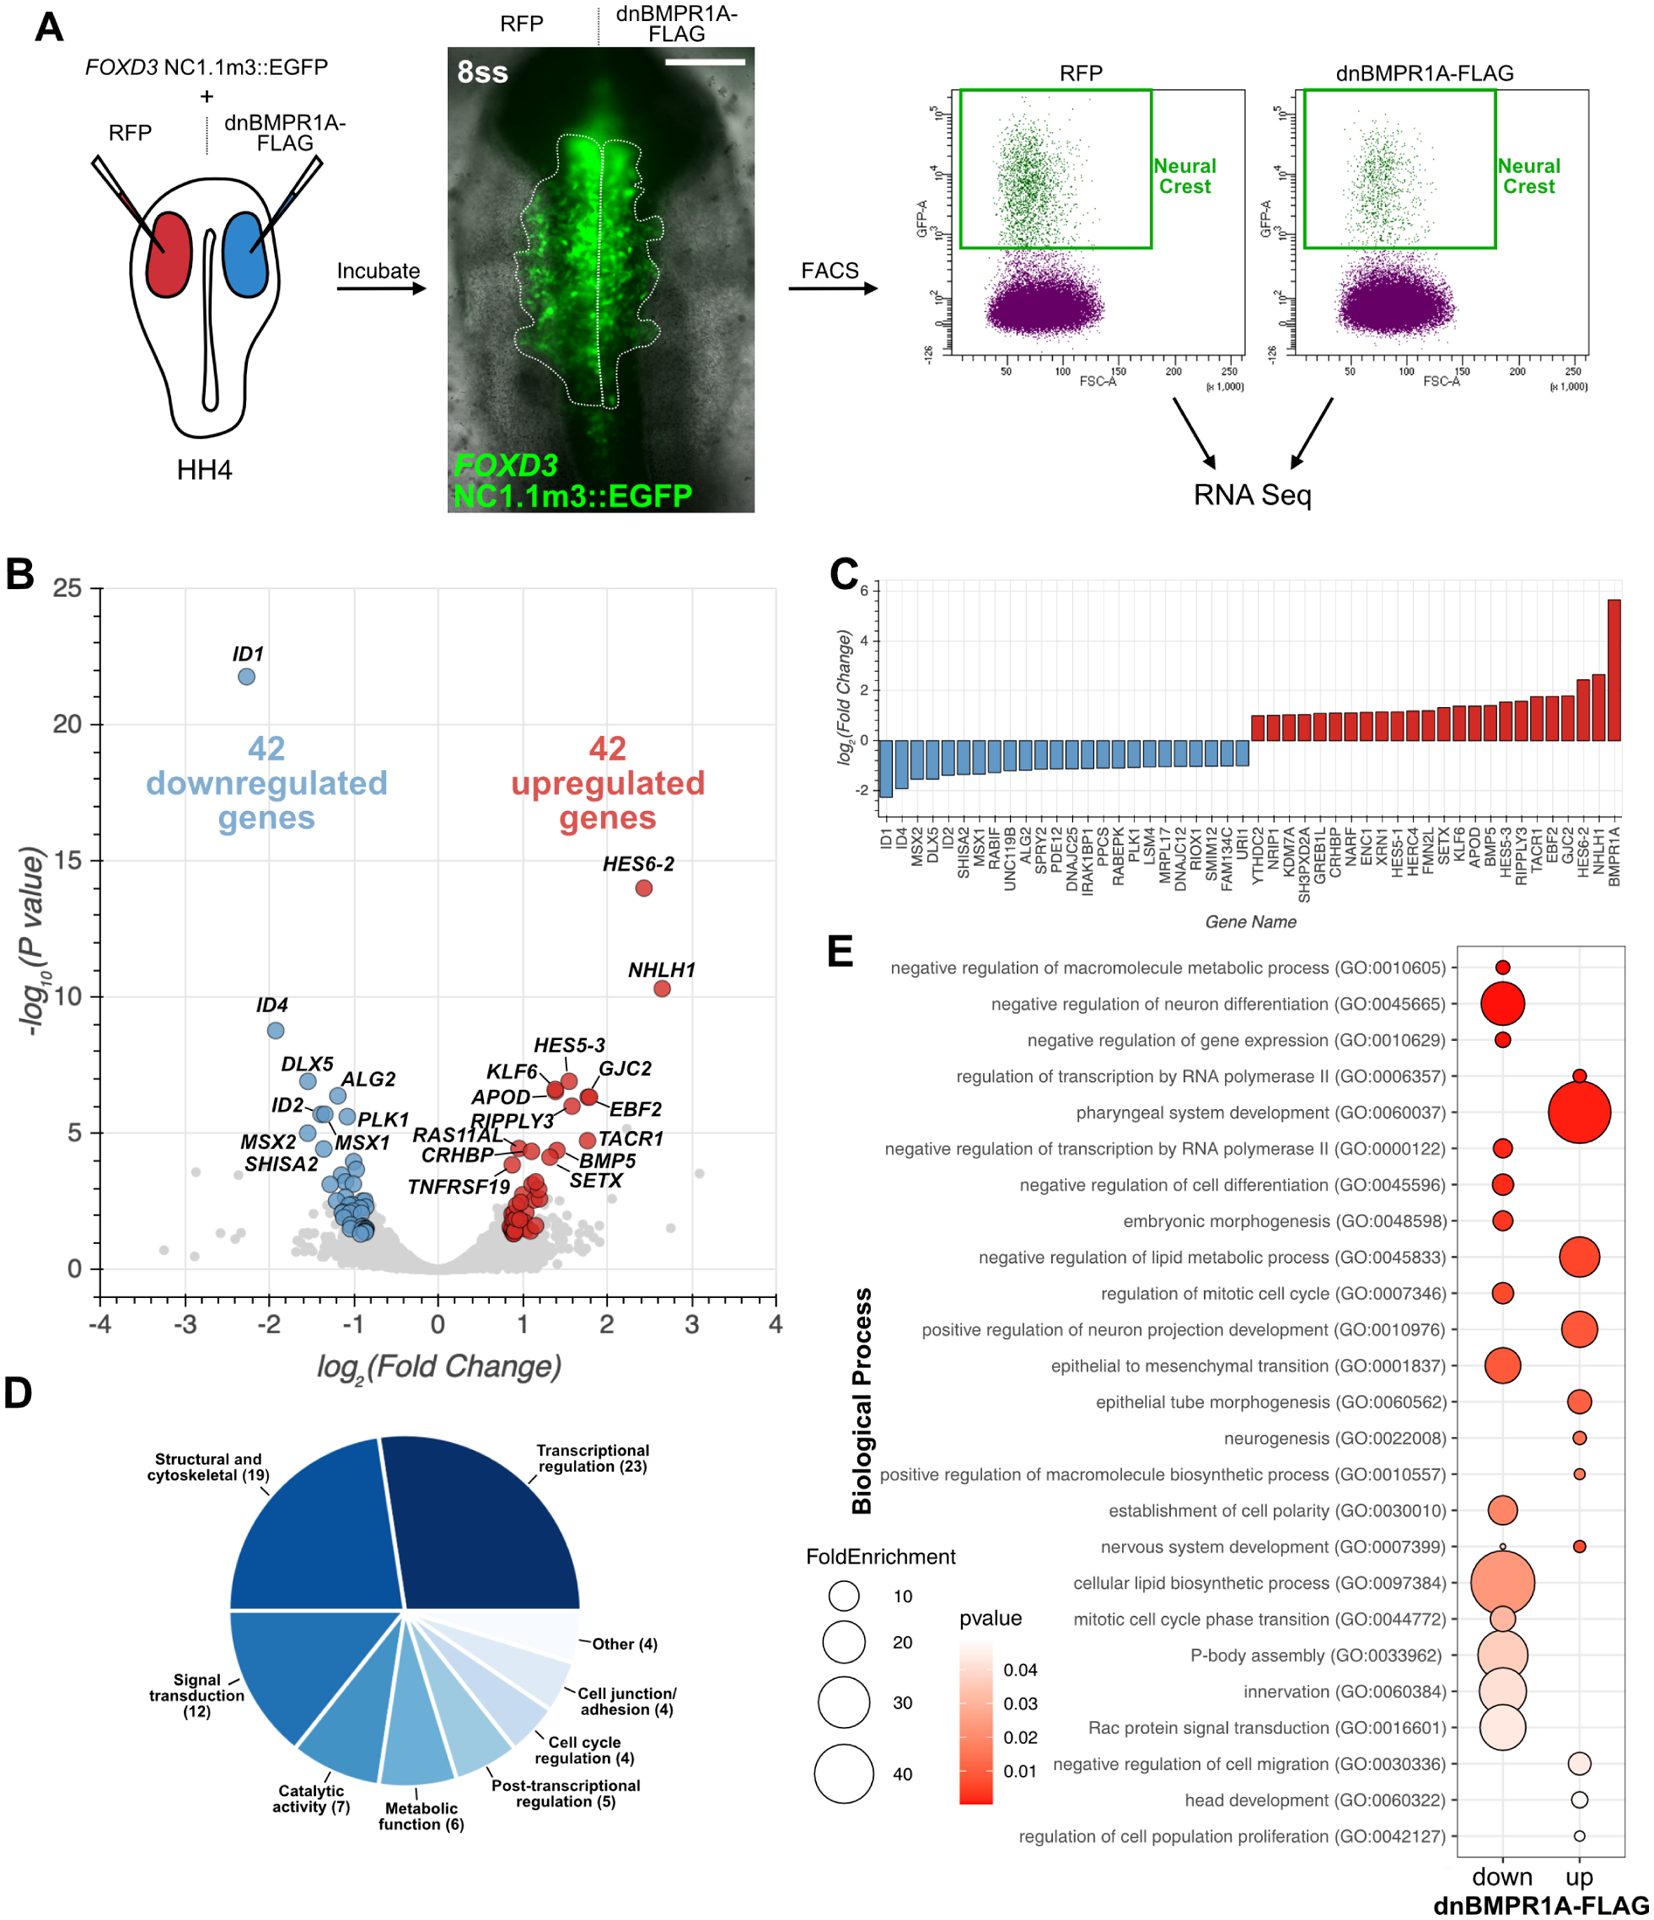
Figure 3: Transcriptome profiling reveals targets of BMP signaling during cranial neural crest EMT.

(A) Diagram of RNA-seq experiment pipeline. Embryos were electroporated with control 2a-RFP or BMP-inhibiting dnBMPR1A-FLAG together with the FOXD3 NC1.1m3 enhancer driving EGFP expression. Embryos were then incubated to delamination stages (8ss) at which point embryos heads were dissociated and EGFP+ neural crest cells were isolated by fluorescence activated cell sorting and used for cDNA library preparation and sequencing. Scale bar represents 100 μm. HH, Hamburger-Hamilton stage; ss, somite stage. (B) Volcano plot displaying the differential gene expression analysis results. Downregulated genes (blue) reflect positive targets of BMP activity, while upregulated genes (red) reflect negative targets of BMP activity. See also Supplemental Figure 2 for additional gene labels. (C) Bar plot displaying differentially expressed genes with the highest fold change. (D) Pie chart showing molecular function categories for differentially expressed genes. In parentheses are the number of dysregulated genes with each molecular function. (E) Bubble plot displaying a subset of enriched Gene Ontology (GO) Biological Processes in the down- and up-regulated gene sets. Bubble color reflects p value and size reflects fold enrichment compared with a random gene set.
