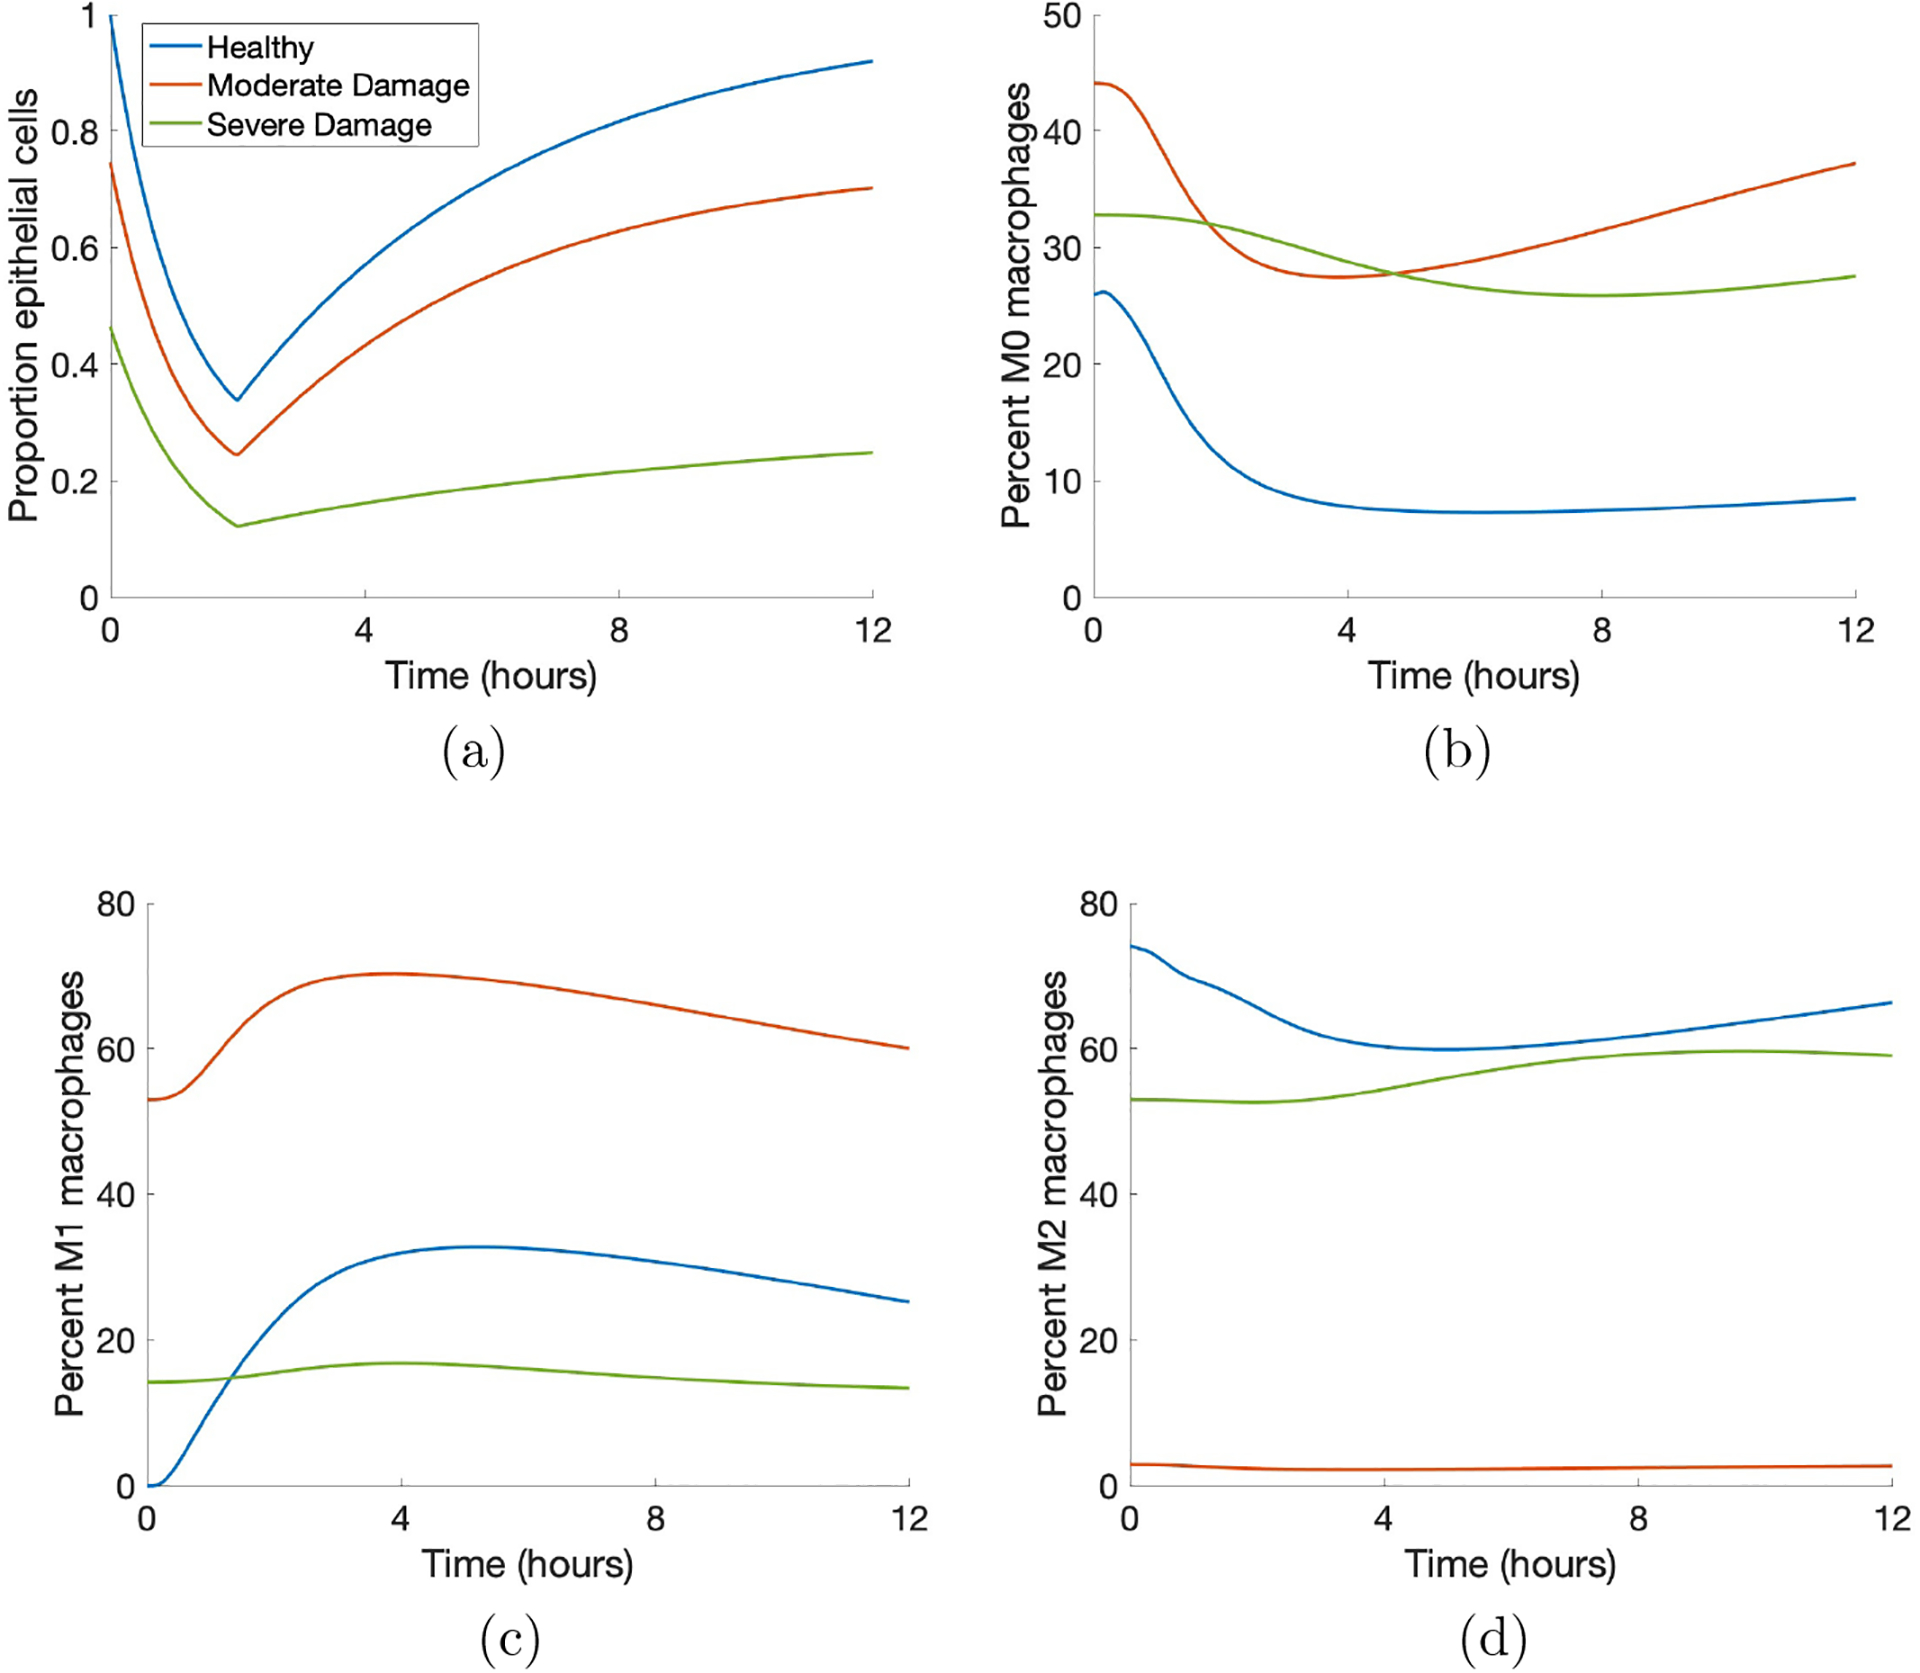
Figure 3: Sample simulations show the variety of model-generated dynamics.

Blue, orange, and green curves indicate healthy, moderate damage and severe damage outcomes, respectively. (a) Proportion healthy epithelial cells. (b) Percent M0 macrophages. (c) Percent M1 macrophages. (d) Percent M2 macrophages.
