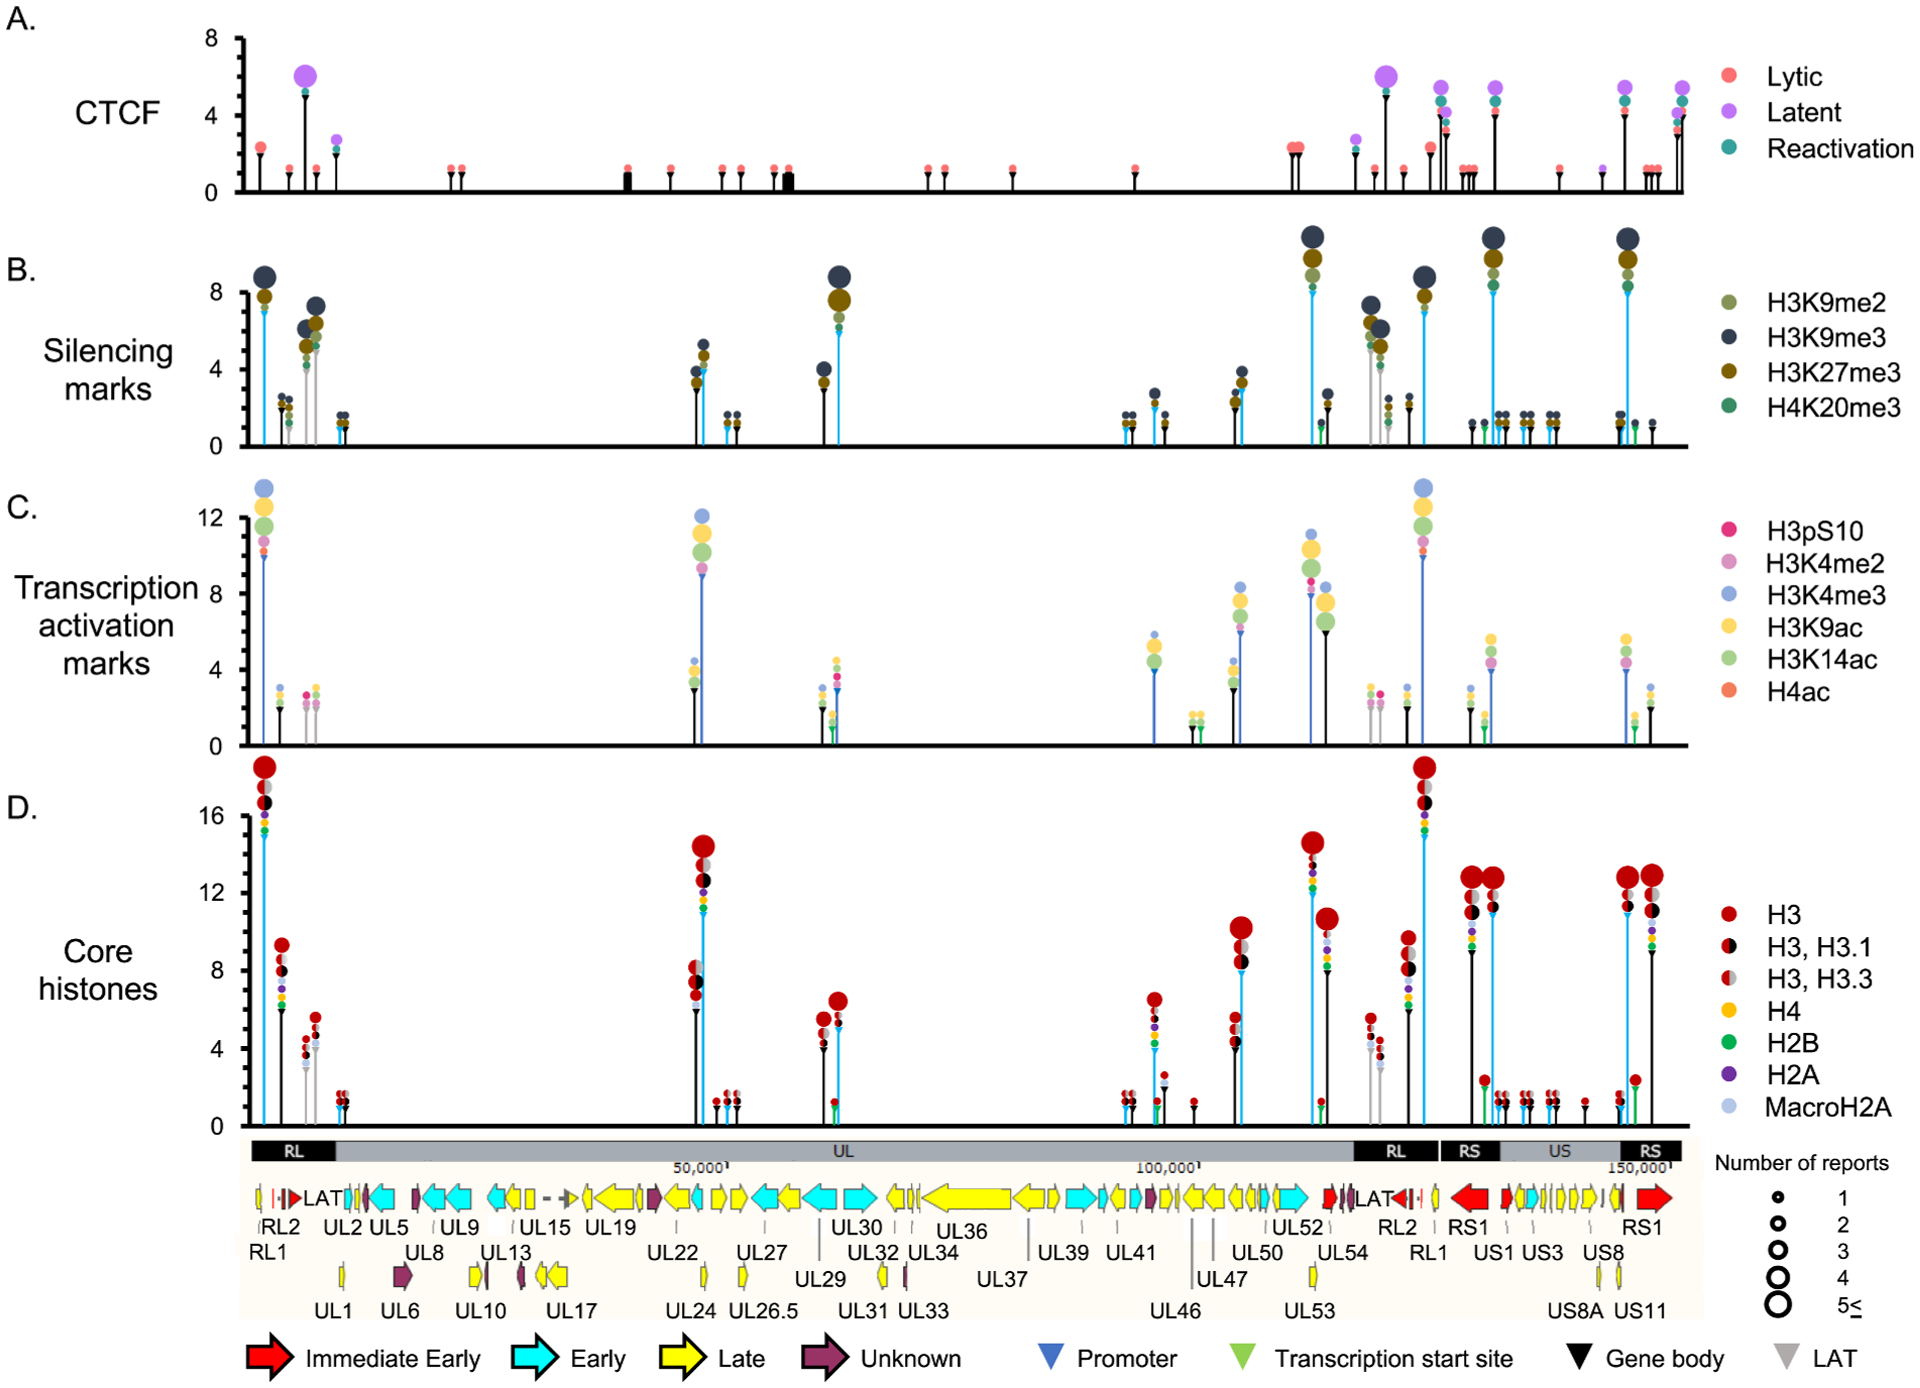
Fig. 7.

Interactions between HSV-1 DNA, core histones, histone H3 or H4 with PTM associated with transcription or silencing, or CTCF. X-axis, HSV-1 genome; Y axes, number of publications describing any association with any given histone, PTM, or CTCF for that particular genome locus. Vertical lines, the regions of the HSV-1 genome analyzed, to scale (i.e., the coverage); Colors of lines (and triangle heads on top), type of infection analyzed (for CTCF), or region of the gene analyzed (promoter, TSS, gene, or LAT) for all others; Colors and sizes of circles on top of each line, histone or PTM analyzed or number of studies analyzing each particular association, respectively. H4ac, H4 acetylated in K5, K8, K12 or K16. Note that several of the loci evaluated are in the repeated regions.
