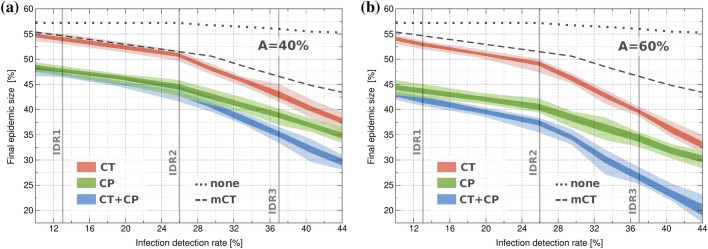
Figure 4.
Final epidemic size for CT, CP, and combined CT + CP strategies for varying values of IDR at two fixed app adoption (A) rates. The cases where no strategy (none) or only manual CT (mCT) is applied are plotted as dashed lines for reference (same for both plots). Results correspond to maximum number of direct close contacts for CP and a delay days since symptoms onset for CT. Darker and lighter coloured areas show the standard deviation and highest/lowest simulation values, respectively.

