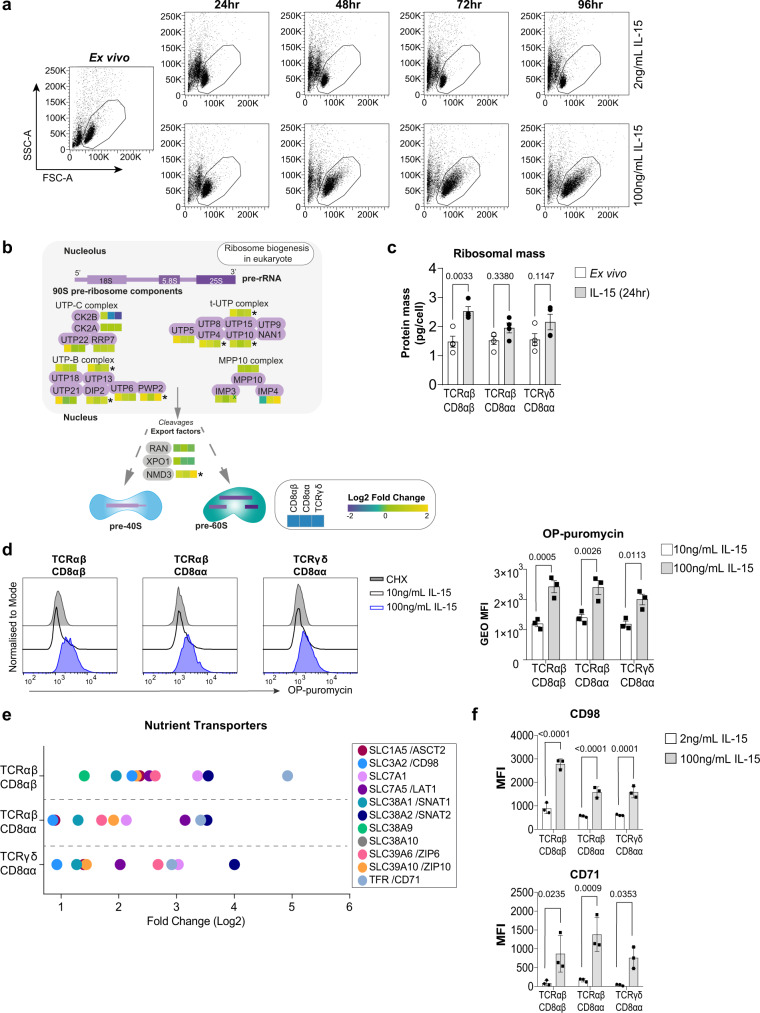
Fig. 3. IL-15/Rα increases IEL protein synthesis, nutrient uptake and growth.
a Dot plots (representative of n = 3 independent experiments) show the forward scatter (FSC, indicator of cell size) vs side scatter (SSC, indicator of granularity) of live IEL over 96 h culture in either 2 ng/mL or 100 ng/mL IL-15/Rα. b Heatmap for proteins pertaining to the pre-90S ribosome. Heatmap squares are corresponding log2 fold-change in copy number expression (IL-15-treated vs unstimulated) for each IEL subset. Asterisks depict significantly changed proteins (p < 0.05) identified in the pathway analysis, exact p-values can be found in Supplementary Data 2. c Bar graph shows the protein content (pg/cell) of the sum of ribosomal proteins (GO:0005840) identified in all IEL subsets ± 24 h IL-15/Rα stimulation (n = 4 biologically independent samples). Statistical significance was derived from two-way ANOVA with Sidak’s multiple comparisons test. d OPP incorporation in IEL (n = 3 biologically independent experiments) cultured with 10 ng/mL or 100 ng/mL IL-15/Rα for 48 h. As a negative control, incorporation was inhibited by cycloheximide (CHX) pre-treatment in IEL cultured with 100 ng/mL IL-15/Rα. Histograms show OPP incorporation in CHX-treated IEL (grey filled), IEL treated with 10 ng/mL IL-15/Rα (black) and IEL treated with 100 ng/mL IL-15/Rα (blue). Bar graph shows the geometric mean fluorescence intensity (GEO MFI) of OPP in each IEL subset (gating strategy shown in Supplementary Fig. 6b), statistical significance was derived from two-way ANOVA with Sidak’s multiple comparisons test. e Dot plot shows the log2 fold-change of nutrient transporters significantly (p < 0.05) differentially expressed in the proteomic dataset. f Flow cytometric analyses of CD98 and CD71 expression from IEL cultured for 72 h in either 2 ng/mL or 100 ng/mL IL-15/Rα (gating strategy as in Supplementary Fig. 1a). Data is presented as mean fluorescence intensity (MFI) (n = 3 biologically independent experiments), statistical significance was derived from two-way ANOVA with Sidak’s multiple comparisons test. All error bars are mean ± s.e.m. For all proteomic data (b, e), statistical significance was derived from two-tailed empirical Bayes moderated t-statistics performed in limma on total proteome, see Supplementary Data 3.

