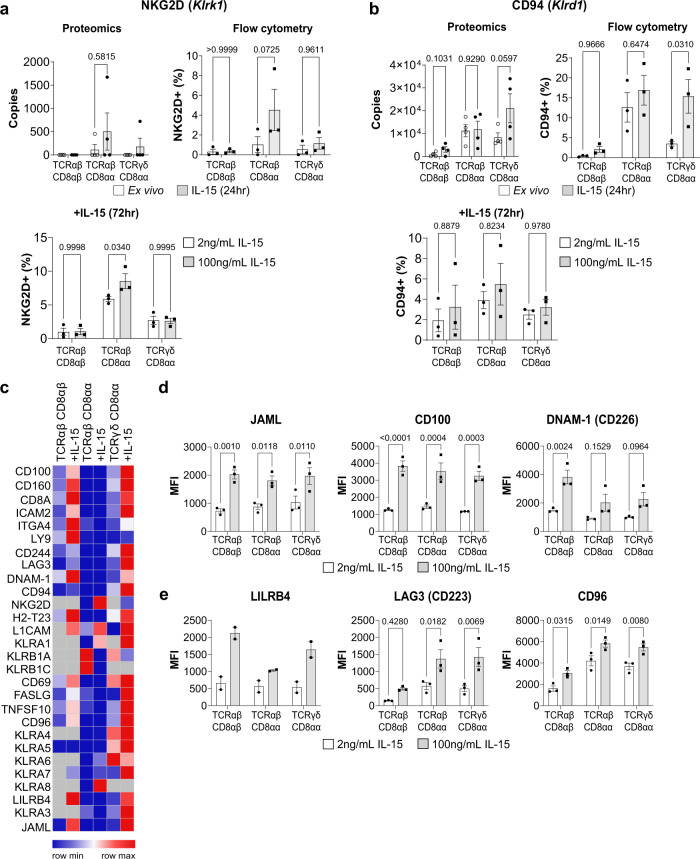
Fig. 6. Activating and inhibitory receptor expression in response to IL-15/Rα stimulation.
Estimated protein copy number/cell of a NKG2D and b CD94, with corresponding flow cytometric analyses on either ex vivo vs 24 h IL-15-stimulated IEL (top left panels) or IEL that had been cultured in 2 ng/mL or 100 ng/mL IL-15/Rα for 72 h (bottom left panels). Flow cytometry data (n = 3 biologically independent experiments) are presented as percentage positive cells following gating on IEL subsets (gating strategy as in Supplementary Fig. 1a). c Row normalized heatmap showing the expression profile of a manually curated list of surface receptors identified in the proteomics across IEL subsets. Grey squares indicate undetectable expression. d, e IEL were cultured in 2 ng/mL or 100 ng/mL IL-15/Rα for 72 h and assessed for their expression of various surface receptors identified in the heatmap. Flow cytometric data are shown as mean fluorescence intensity (MFI) for d activating receptors; JAML, CD100 and DNAM-1, and e inhibitory receptors; LILRB4, LAG3 and CD96. Gating strategy as in Supplementary Fig. 1a (n = 3 biologically independent experiments, except for LILRB4 (n = 2 biologically independent experiments). All error bars are mean ± s.e.m. For all proteomic data (top right panels a, b), statistical significance was derived from two-tailed empirical Bayes moderated t-statistics performed in limma on total proteome, see Supplementary Data 3. All flow cytometry data (a, b, d, e) were analysed by two-way ANOVA with Sidak’s multiple comparisons test.

