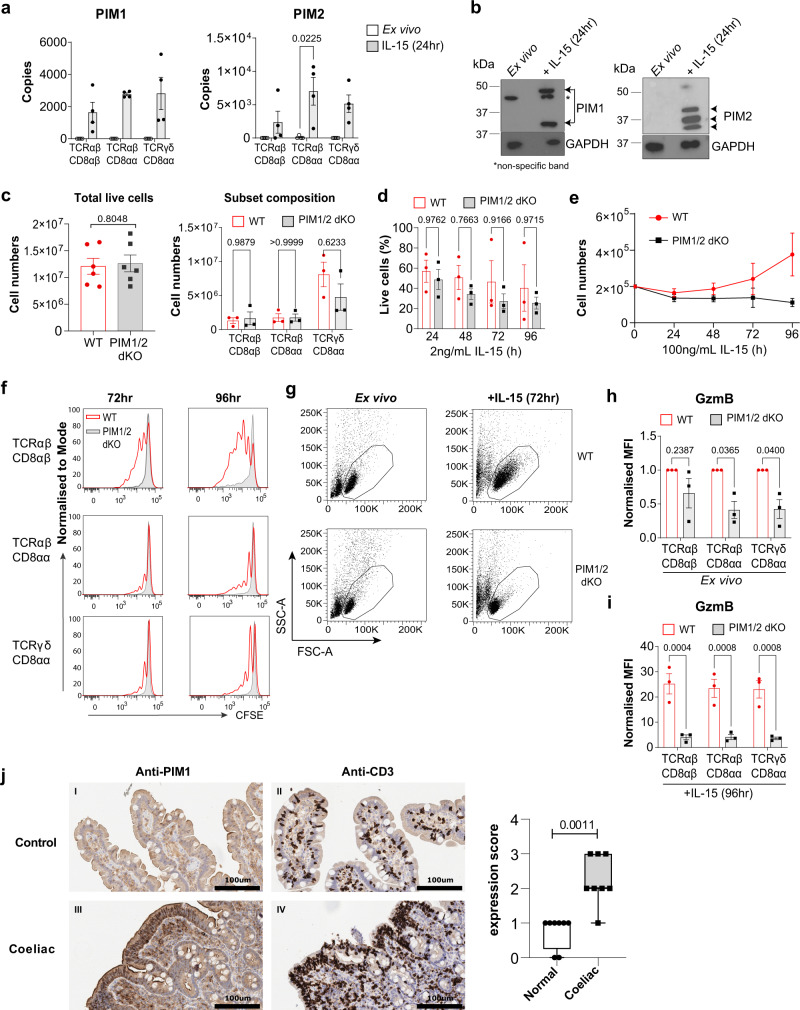
Fig. 7. PIM kinases regulate IEL responses to strong IL-15/Rα stimulation.
a Estimated copy number/cell of PIM1 and PIM2 kinases in IEL ± 24 h IL-15/Rα stimulation (n = 4 biologically independent experiments), statistical significance was derived from two-tailed empirical Bayes moderated t-statistics performed in limma on total proteome, see Supplementary Data 3. b Immunoblot data (representative of n = 3 biologically independent experiments) showing PIM1 (right) and PIM2 (left) expression in ex vivo IEL or 24 h IL-15-stimulated IEL. Antibodies against GAPDH were used as a loading control. c Bar graphs show the absolute cell counts (left; n = 6 biologically independent experiments) and subset composition (right; n = 3 biologically independent experiments) of IEL isolated from WT (red) and PIM1−/−/PIM2−/Y (PIM1/2 dKO) (grey) mice (gating strategy shown in Supplementary Fig. 6c). d The percentage of live IEL from either WT or PIM1/2 dKO mice that were cultured in 2 ng/mL IL-15/Rα for 96 h (n = 3 biologically independent experiments). Percentages were calculated from the number of live cells following IL-15/Rα treatment divided by the number of cells seeded for culture (1 million/mL) every 24 h. e Line graph shows the cell numbers of IEL from either WT or PIM1/2 dKO mice that were cultured in 100 ng/mL IL-15/Rα for 96 h (n = 3 biologically independent experiments). f IEL were isolated from WT and PIM1/2 dKO mice and stained with CellTrace CFSE prior to stimulation with 100 ng/mL IL-15/Rα for 4 days. Every 24 h cells were stained for subsets and CFSE expression was analysed by flow cytometry (gating strategy as in Supplementary Fig. 1a). The discrete peaks in the histograms represent successive generations of live, DAPI-negative IEL (n = 3 biologically independent experiments). g Dot plots (representative of n = 3 biologically independent experiments) show the forward scatter (FSC) vs side scatter (SSC) of live IEL ex vivo as compared to IEL cultured in 100 ng/mL IL-15/Rα for 72 h from both WT (top) and PIM1/2 dKO (bottom) mice. IEL that were h derived ex vivo and i cultured in 100 ng/mL IL-15/Rα from both WT and PIM1/2 dKO mice were stained for intracellular GzmB expression (gating strategy as in Supplementary Fig. 1a), presented as mean fluorescence intensity (MFI) normalized to h WT controls or i cells cultured in 2 ng/mL IL-15/Rα (n = 3 biologically independent experiments). j Representative images of normal duodenal (n = 8) or duodenal biopsies with histological features of coeliac disease (n = 8) stained with anti-PIM1 and anti-CD3 antibodies (scale bar = 100 µm). I and II (top panels) show a biopsy of normal control duodenum and III and IV (bottom panels) show features consistent with coeliac disease. Boxplot demonstrates semi-quantitative assessment of PIM1 immunohistochemical staining intensity from biopsies, whiskers are minima to maxima with all points shown. All error bars are mean ± s.e.m. For (c, right panel) a two-tailed unpaired t-test with Sidak’s multiple comparisons test and j two-tailed Mann–Whitney test was used to derive statistical significance. (c, left panel), d, h, i were analysed by two-way ANOVA with Sidak’s multiple comparisons test.

