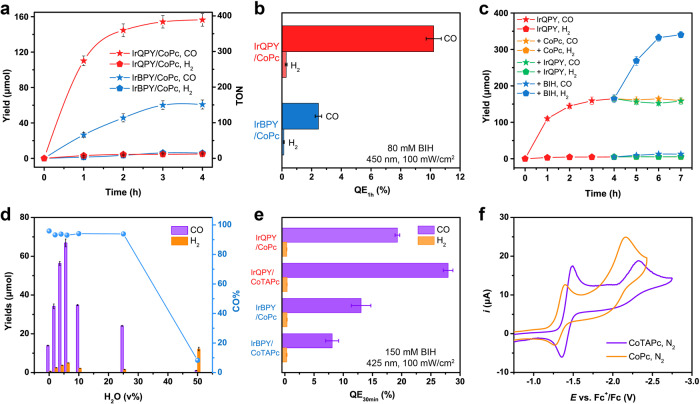
Fig. 3. Photocatalytic CO2 reduction.
a Time profiles of photocatalytic CO (star) and H2 (pentagon) formation with IrQPY/CoPc (red) or IrBPY/CoPc (blue) system. b QEs for CO and H2 formation from IrQPY/CoPc (red) and IrBPY/CoPc (blue) systems. c Time profiles of photocatalytic CO (star) and H2 (pentagon) formation from IrQPY/CoPc (red) system. After 4 h, fresh CoPc (0.4 µmol, orange), IrQPY (0.4 µmol, green), or BIH (32 µmol, blue) was dispersed in 0.5 mL CO2-saturated CH3CN and injected into the solution, respectively. d Photocatalytic CO (violet) and H2 (orange) yield with IrQPY/CoPc and varying volumes of H2O, and corresponding CO% are shown (blue circle). e QEs for CO (violet) and H2 (orange) formation from IrQPY/CoPc, IrBPY/CoPc IrQPY/CoTAPc, and IrBPY/CoTAPc systems with 150 mM BIH and 425 nm light within 30 min. f CVs of CoPc (orange) and CoTAPc (violet) under N2. The error bars in the plots represent the standard deviations of three independent measurements.

