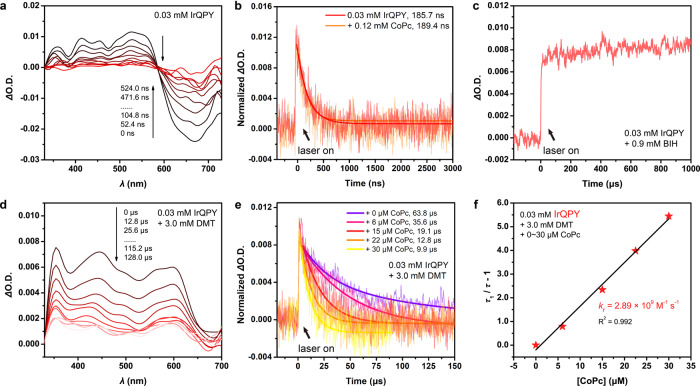
Fig. 6. Transient absorption spectroscopy.
a TA spectrum of 0.03 mM IrQPY. b TA decay traces of 0.03 mM IrQPY in the absence (red) or presence (orange) of 0.12 mM CoPc at 530 nm. c TA decay trace of 0.03 mM IrQPY in the presence of 0.9 mM BIH at 350 nm. d TA spectrum of 0.03 mM IrQPY in the presence of 3.0 mM DMT. e TA decay traces of 0.03 mM IrQPY with 3.0 mM DMT in the absence (violet) or presence of 6 (pink), 15 (red), 22 (orange), 30 (yellow) μM CoPc at 350 nm. f Plot of (τ1/τ − 1) versus [CoPc] with linear fitting for the IrQPY system. The excitation wavelength is 355 nm.

