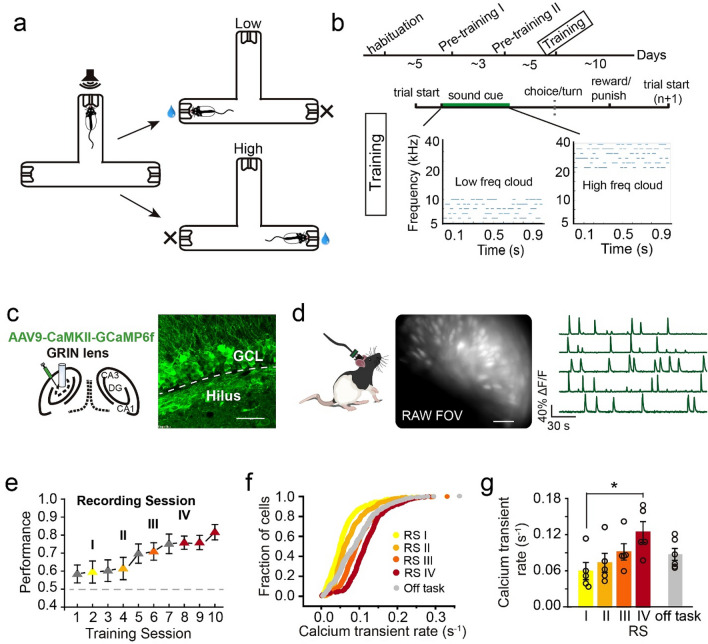
Figure 1.
DGC activity intensified during auditory task learning. (a,b) Schematics of an auditory-cued decision task and the training timeline. Low or high frequency tone clouds were associated with a reward in the left or right port, respectively. (c) Left, schematic of AAV-GCaMP6f injection and lens implantation in the DGC layer. Right, expression of GCaMP6f in DGCs (scale bar: 50 µm, GCL: granule cell layer). (d) Cell detection with the miniature microscope (raw view) in a freely moving rat. Example Ca2+ signal traces from the signal processing algorithm CNMF-e. (e) Task learning progress on task performance. The Ca2+ imaging sessions were labeled yellow, light orange, dark orange and red, indicating learning progress (gray: sessions without Ca2+ recording). (f) Ca2+ transient rate in all recording sessions and an off-task session (RS I: 529 cells, RS II: 458 cells, RS III: 515 cells, RS IV: 359 cells, Off task: 412 cells). (g) Quantification of Ca2+ transient rate in each recording session (RS) and an off-task sessions (n = 5 rats, mean ± SEM, Kruskal–Wallis test, *P < 0.05).

