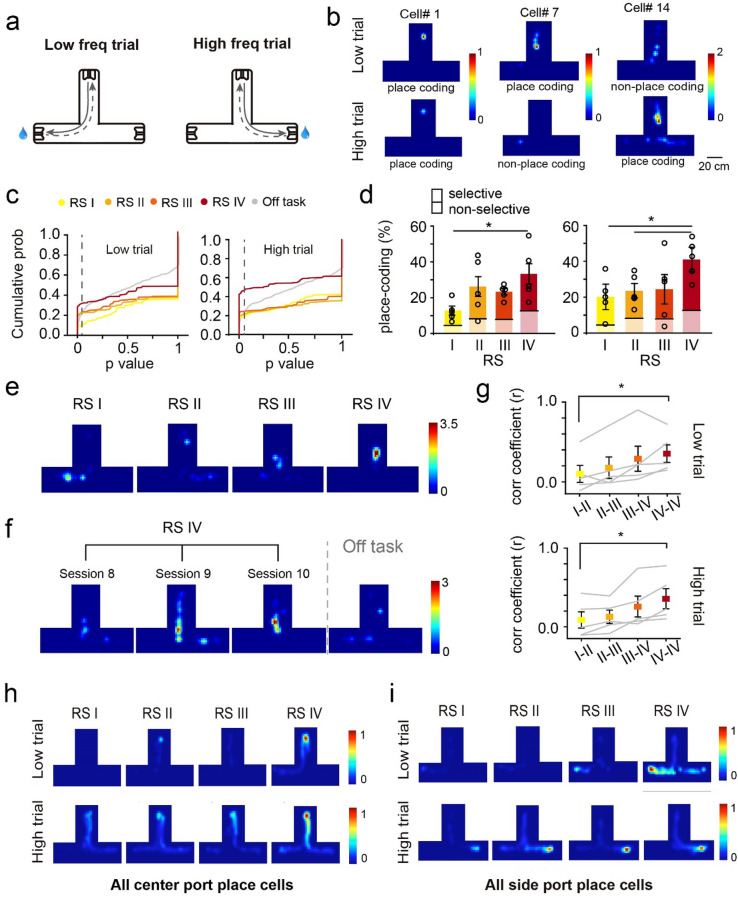
Figure 2.
Dynamic place-coding in the dentate gyrus during the auditory task learning. (a) Schematic of low and high trial routes. (b) example place-coding cells. (c) Cumulative probability of the P values in spatial information analysis in each learning RS and off-task session in low (left) and high (right) trials (dashed line indicates the place cell threshold P value, 0.05). (d) Quantification of the ratio of place-coding cells in low (left) and high (right) trials (solid color: trial type-selective cells, transparent color: non-trial type-selective cells, n = 5 rats, mean ± SEM, Kruskal–Wallis test, *P < 0.05). (e) Example of DGC remapping during learning. (f) Example of DGC showing stable place fields in the three sessions of RS IV and remapping in the following off-task session. (g) Correlation coefficients of Ca2+ transient events between two recording sessions and different sessions in RS IV in low (top) and high (bottom) trials (n = 5 rats, mean ± SEM, Kruskal–Wallis test, *P < 0.05). (h) Ca2+ transient rate overlay heatmap of all the place cells that have the highest firing rate near the center port in low or high trials in each RS (color bar, normalized Ca2+ transient rate to that in RS IV sessions for comparison). (i) Ca2+ transient rate overlay heatmap of all the place cells that have highest firing rate near the side port in low or high trials in each RS (color bar, normalized Ca2+ transient rate to that in RS IV for comparison).

