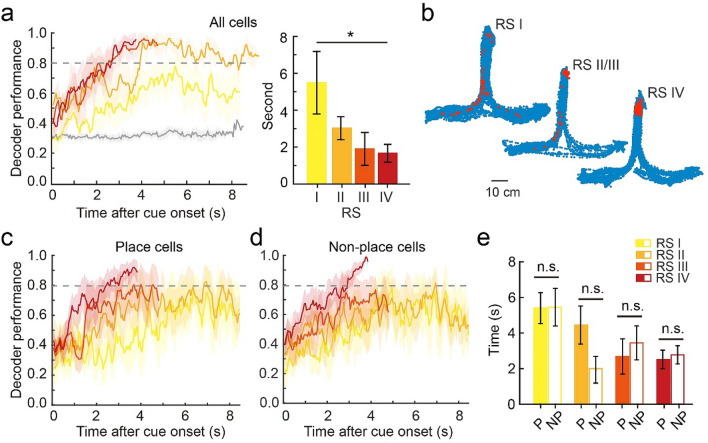
Figure 5.
Activity of DGC ensembles represents auditory decisions. (a) Left, decoder performance in each frame after cue onset in each learning RS showing the maximum frame number per trial for each rat (gray line indicates the shuffled data in RS I). Right, quantification of frames needed to reach 80% decoder performance after cue onset (n = 5, Wilcoxon signed-rank test, mean ± SEM, *P < 0.05). (b) Trajectory with decoder location in each RS (blue: rat’s location across the entire session, red: rat’s location at the frame with 80% decoder performance). (d,e) Place-coding and non-place-coding decoder performance. (e) Quantification of frames needed to reach 80% decoder performance after cue onset using only place-coding (P) or non-place-coding (NP) cells (n = 5 rats, mean ± SEM, Wilcoxon signed-rank test, n.s., P > 0.05).

