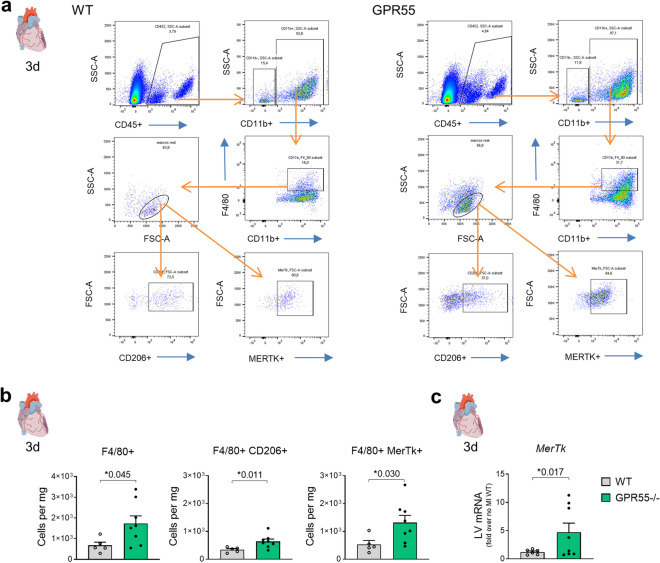
Figure 3.
Impact of GPR55 deficiency on cardiac macrophage expansion following MI. (a) Representative gating for flow cytometric quantification of F4/80+ macrophages and CD206+ as well as MERTK+ populations in WT and GPR55−/− hearts. (b) Quantification of total macrophage counts and subsets 3 days post-MI in WT and GPR55−/− mice. (c) LV Mertk gene expression in WT and GPR55−/− mice 3 days post-MI relative to no MI WT. Bars indicate mean ± SE (n = 5–10/group) (Student’s t-test).

