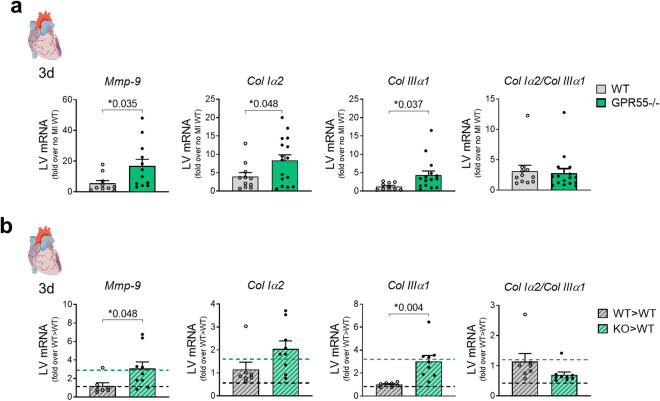
Figure 5.
Impact of GPR55 deficiency on ECM factors following MI. LV gene expression of Mmp-9, collagen Iα2, collagen IIIα1 and collagen variant transcript ratio 3 days post-MI in (a) WT and GPR55−/− mice, fold over no MI WT (n = 10–16/group) and (b) WT > WT and KO > WT fold over WT > WT. Dotted lines indicate transcript levels in WT and global GPR55−/− mice 3 days post-MI, as fold over WT MI. Bars indicate mean ± SE (n = 7–9/group) (Two-way ANOVA with Sidak’s post hoc test or student’s t-test, as appropriate).

