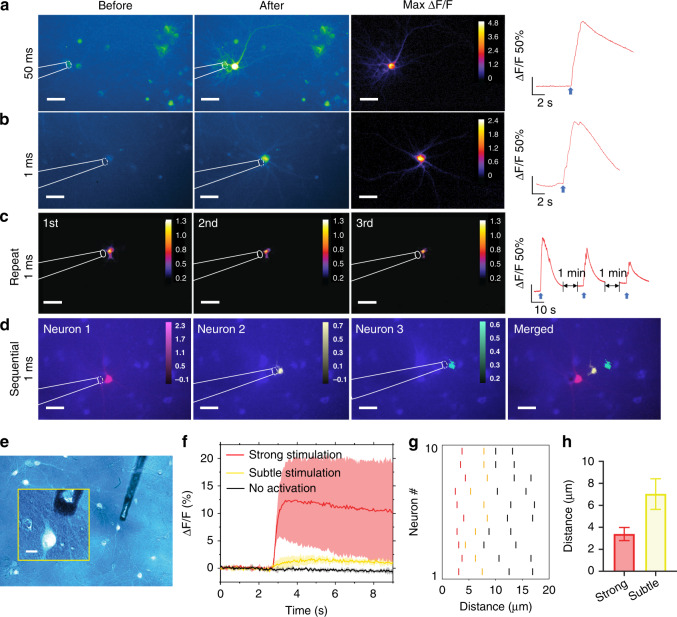
Fig. 2. Fluorescence images of GCaMP6f-expressing neurons in response to TFOE stimulation.
a, b Fluorescence images and calcium traces in sparse population stimulated by TFOE with a laser duration of 50 ms (a) and 1 ms (b). The fluorescence images with the peak intensity after stimulation are shown as “after”. Blue arrows: laser onset. c Max ∆F/F images of one neuron undergone repeated TFOE stimulation three times. Right: calcium signal of the neuron. Blue arrows: laser onset. d Sequential stimulation of three neurons. Max ∆F/F labeled in red, yellow, green respectively superimposed with the fluorescence image. Scale bars: 50 µm. e Merged fluorescence image and transmission image of neuron culture. Inset: zoom-in of the targeted neuron and the TFOE tip. Scale bar: 10 µm. f Representative fluorescence signals evoked at the targeted neuron by TFOE stimulation. Average Calcium signals induced by strong neuron stimulation when the TFOE was placed at µm (Red), subtle stimulation when the TFOE was placed at 5–10 µm (Yellow) and no activation when the distance was µm (Black). Shaded areas: the standard deviation from 10 neurons. g Calcium response as a function of distance at targeted neurons upon TFOE stimulation. 10 neurons were tested individually. For each neuron, four different distances were tested. Calcium responses were characterized by color bars with the red bars corresponding to the strong stimulation similar to the red curve in (f), the yellow bars corresponding to the subtle stimulation and the black bars for no activation. h Average distances to evoke strong and subtle activations. Laser condition for (e–h): 11.4 mW, 1 ms, 1.7 kHz.

