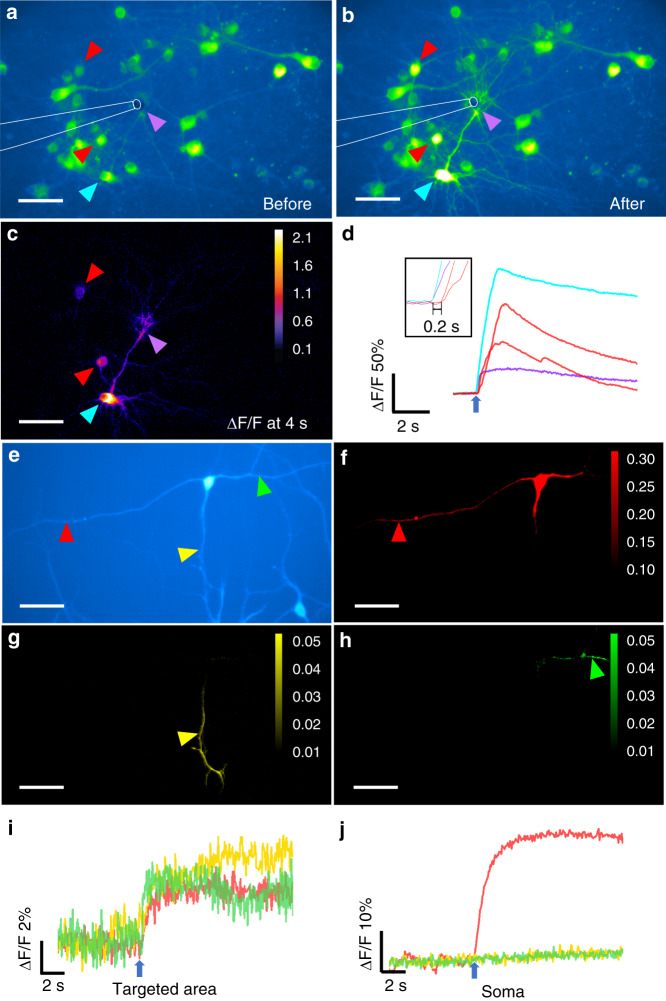
Fig. 4. TFOE evoked sub-cellular stimulation on neurites.
a–b TFOE evoked neurites activation with calcium wave propagating along the neuron network. Colored arrows: targeted area (purple), neuron 1 (cyan) and neuron 2, 3 (red). c ΔF/F of calcium signal at 4 s after laser onset. d Calcium traces of targeted area (purple), neuron 1 (cyan), and neuron 2 and 3 (red), as labeled in (a). Inset: Zoom-in of calcium signals immediately after the laser onset. Blue arrow: laser onset. e A multipolar neuron stimulated with a TFOE selectively targeting the axon (red arrow) and dendrites (yellow and green arrows). f–h Maximum ΔF of calcium signal upon stimulation of different areas. i Calcium traces measured at the targeted neurites as labeled in (e) by red, yellow and green arrows, respectively. j Calcium traces measured at the soma upon stimulation of different neurites. Blue arrows in (i–j): laser onset. Scale bars in (a–c), (e–h): 50 µm

