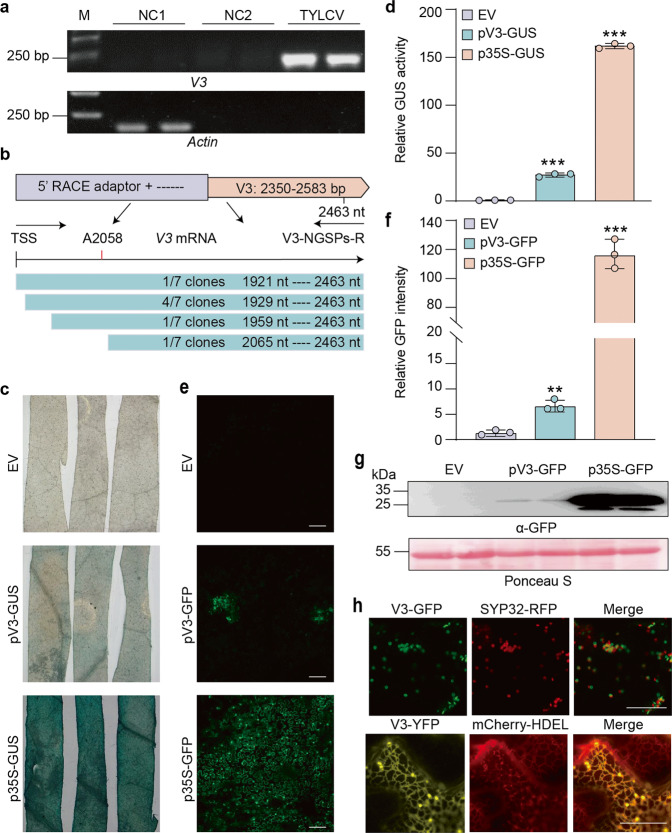
Fig. 3. ORF6/V3 is expressed during the infection and encodes a Golgi-localized protein.
a RT-PCR analysis of V3 transcripts from TYLCV-infected or uninfected N. benthamiana plants. M: DNA ladder marker. NC1: negative control 1 (reverse-transcription of total RNA extracted from uninfected plants with RT Primers). NC2: negative control 2 (reverse-transcription of total RNA extracted from uninfected plants with V3-specific primers). TYLCV: reverse-transcription of total RNA extracted from TYLCV-infected plants with V3-specific primers. This experiment was repeated three times with similar results; representative images are shown. b Transcriptional start site analysis of TYLCV V3 by 5ʹ RACE. TSS: transcription start site. A2058: V3 TSS captured by RSV cap-snatching (Lin et al., 2017). c Activity of pV3 promoter (and p35S promoter as positive control) in promoter-GUS fusions in transiently transformed N. benthamiana leaves at 2 dpi. EV: empty vector. This experiment was repeated three times with similar results; representative images are shown. d Quantification of relative GUS activity in samples from (c). Data are the mean of three independent biological replicates. Error bars represent SD. An asterisks indicate a statistically significant difference according to unpaired Student’s t test (two-tailed), *** p < 0.001. e Activity of pV3 promoter (and p35S promoter as positive control) in promoter-GFP fusions in transiently transformed N. benthamiana leaves at 2 dpi. Scale bar: 100 μm. EV: empty vector. This experiment was repeated three times with similar results; representative images are shown. f Quantification of relative GFP intensity in samples from (e). Data are the mean of three independent biological replicates. Error bars represent SD. Asterisks indicate a statistically significant difference according to unpaired Student’s t test (two-tailed), ** p < 0.01, *** p < 0.001. g Western blot analysis of GFP protein from (e). Ponceau S staining of the large RuBisCO subunit serves as loading control. EV: empty vector. This experiment was repeated three times with similar results; representative images are shown. h Co-localization of V3-GFP with the cis-Golgi maker SYP32-RFP (upper panel) and co-localization of V3-YFP with the ER maker mCherry-HDEL (lower panel). Scale bar: 20 μm. The TYLCV isolate used in these experiments is TYLCV-BJ. The original data from all experiments and replicates can be found in the Source data file.

