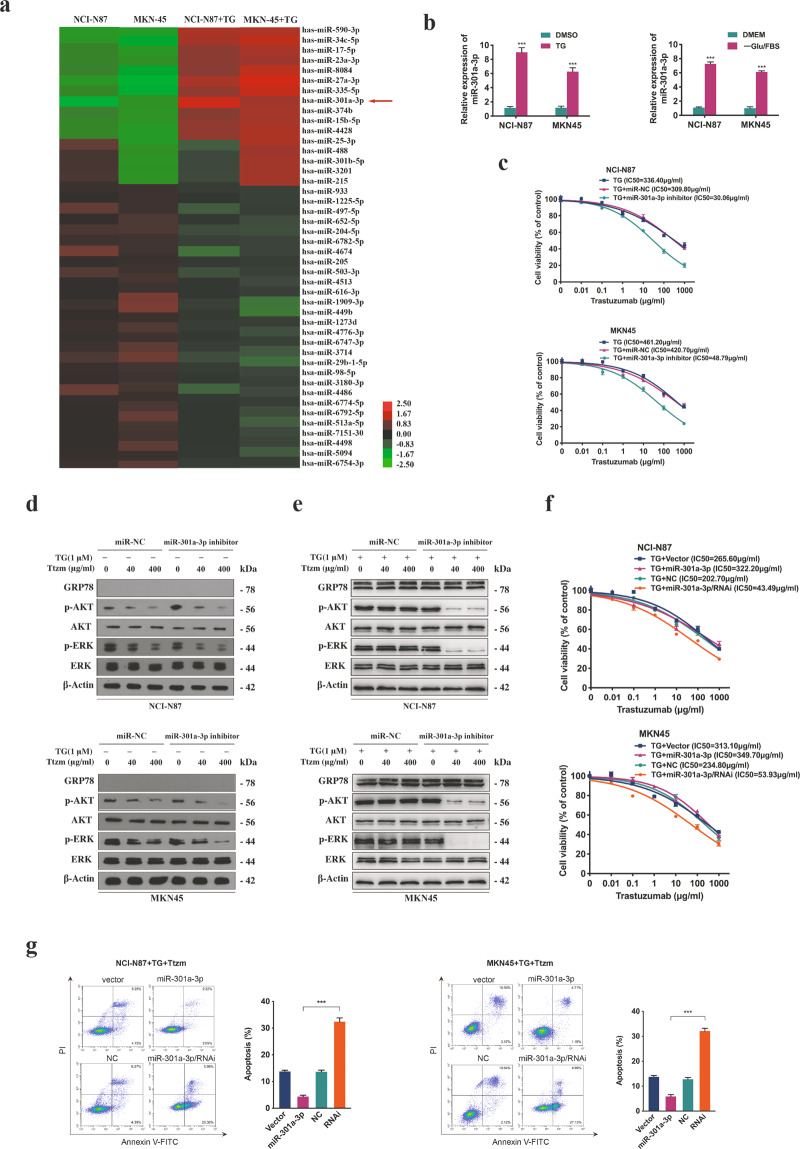
Fig. 2. Identification of miR-301a-3p and the effect on trastuzumab resistance.
a Microarray assay of NCI-N87 and MKN45 cells which were treated with or without 1 μM TG for 12 h. Hierarchical clustering of the expression levels of miRNAs in cells. Red and green represent high or low relative expression, respectively. Increased and decreased miRNAs levels were determined by P < 0.05 and >2.5 folds difference in expression compared with the blank control. The arrow represents miR-301a-3p. b The relative expression level of miR-301a-3p level in NCI-N87 and MKN45 cells treated with 1 μM TG for 12 h or -Glu/FBS for 24 h. c CCK8 assay of NCI-N87 and MKN45 cells after transfection with miR-301a-3p inhibitor or control agents before trastuzumab treatment at indicated concentrations for 72 h (n = 3). d Protein level in NCI-N87 and MKN45 cells after transfection with miR-301a-3p inhibitors or control followed by 40 or 400 μg/ml trastuzumab treatment for 72 h. e The certain proteins in NCI-N87 and MKN45 cells after transfection with miR-301a-3p inhibitors or control detected by Western blot. The cells were treated with 1 μM TG for 12 h followed by 40 or 400 μg/ml trastuzumab treatment for 72 h. f CCK8 assay of miR-301a-3p stably transfected and control cells. The NCI-N87 and MKN45 cells were treated with 1 μM TG for 12 h followed by trastuzumab treatment for 72 h (n = 3). g Flow cytometry was used to measure the apoptosis of miR-301a-3p stably transfected and control cells after treated with 1 μM TG for 12 h followed by 400 μg/ml trastuzumab treatment for 72 h (n = 3). Statistical analysis was performed by Student’s t-test, error bars indicate SD (***p < 0.001).

