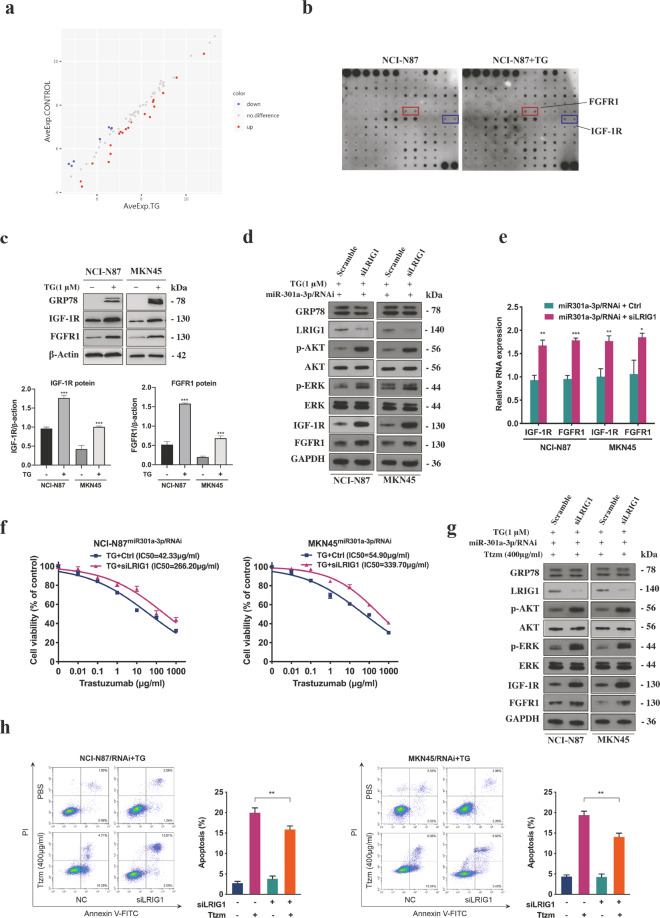
Fig. 4. LRIG1 regulated by miR-301a-3p mediated trastuzumab resistance through activating the expression of IGF-1R and FGFR1.
a Differential expression proteins. The basic statistic used for significance analysis is fold change. Results include (log2) the fold changes of every protein and its contrast individually. Scatter plot: red presents upregulation, blue presents downregulation, and grey presents no difference. b Whole-cell extracts from NCI-N87 cells after treated with or without 1 μM TG for 12 h were incubated in the arrays of RTK antibody. Phosphorylated proteins were measured by incubating with anti-phosphotyrosine horseradish peroxidase. c Representative western blot and quantification for IGF-1R and FGFR1 in NCI-N87 and MKN45 cells after treated with or without 1 μM TG for 12 h. d Western blot analysis of indicated proteins in miR-301a-3p knockdown NCI-N87 and MKN45 cells treated with 1 μM TG for 12 h followed by transfection with LRIG1 siRNAs (siLRIG1) or NC. e qRT-PCR analysis of IGF-1R and FGFR1 mRNA in miR-301a-3p knockdown NCI-N87 and MKN45 cells after transfection with siLRIG1 or control (n = 3). f CCK8 assay of ER stressed miR-301a-3p knockdown NCI-N87 and MKN45 cells transfected with siLRIG1 or control before or control and treated with TG and followed by trastuzumab treatment (n = 3). g Western blot analysis of certain proteins in ER stressed miR-301a-3p knockdown NCI-N87 and MKN45 cells transfected with siLRIG1 or control followed by 400 μg/ml trastuzumab treatment for 72 h. h Flow cytometry was used to measure the apoptosis of ER stressed miR-301a-3p knockdown NCI-N87 and MKN45 cells transfected with siLRIG1 or control after exposure to 400 μg/ml trastuzumab for 72 h (n = 3). Statistical analysis was performed by Student’s t-test, error bars indicate SD (*p < 0.05, **p < 0.01, ***p < 0.001).

