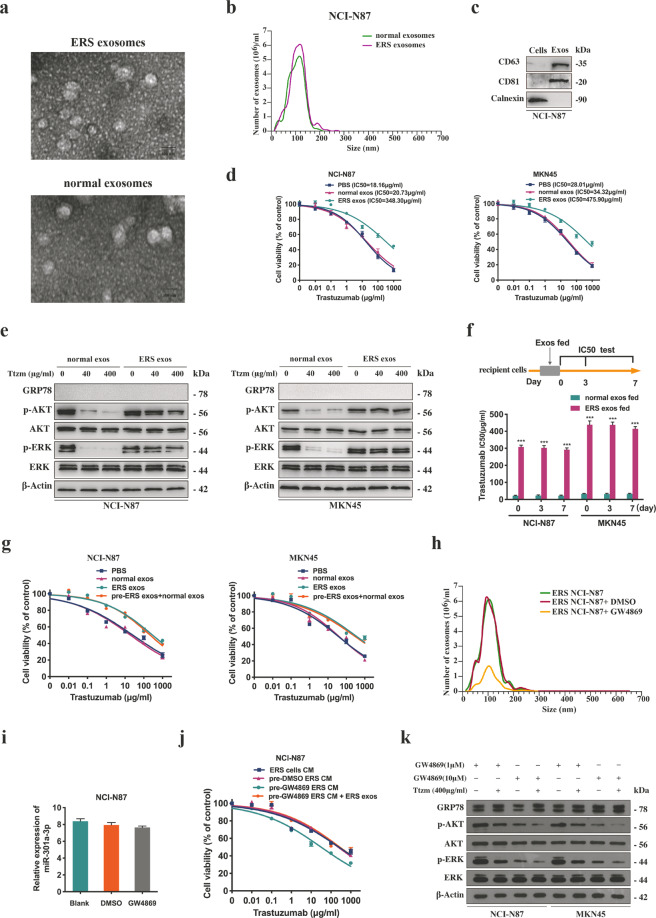
Fig. 5. ER stress transmitted trastuzumab resistance by releasing exosomes.
a Electron microscopy images of exosomes secreted by NCI-N87 cells following treatment with or without 1 μM TG for 12 h. Scale bar: 100 nm. b Nanosight particle tracking was used to analyze the sizes and counts of the exosomes secreted by NCI-N87 cells after treated with or without 1 μM TG for 12 h. c CD36 and CD81, the markers for exosomes, were detected in exosomes secreted by NCI-N87 cells after treated with 1 μM TG for 12 h by western blot. d CCK8 assay of NCI-N87 and MKN45 cells treated by certain exosomes (PBS as control) for 48 h before trastuzumab treatment for 72 h (n = 3). e Western blot analysis of certain proteins in NCI-N87 and MKN45 cells treated by indicated exosomes for 48 h before trastuzumab treatment for 72 h. f NCI-N87 and MKN45 cells were cultured with indicated exosomes for 48 h. IC50 value of trastuzumab on the 0, 3rd, 7th day was detected by CCK8 assay, respectively (n = 3). g After treatment of ER stressed exosomes for 48 h, MKN45 and NCI-N87 cells were then incubated with normal exosomes, and subjected to CCK8 assay upon trastuzumab treatment for 72 h (n = 3). h Nanosight particle tracking was used to analyze the size and counts of the exosomes secreted by the NCI-N87 cells treated by 1 μM TG for 12 h followed by 10 μM GW4869 treatments for 24 h. i qRT-PCR analysis of miR-301a-3p in NCI-N87 cells after treatment with 1 μM TG for 12 h followed by 10 μM GW4869 treatments for 24 h (n = 3). j CCK8 assay of the NCI-N87 cells treated with different sources of CM for 24 h before trastuzumab treatment for 72 h (n = 3). k Western blot analysis of certain proteins in MKN45 and NCI-N87 cells. Cells were treated with different sources of CM with or without 1 or 10 μM GW4869 treatment for 24 h, and then treated by 400 μg/ml trastuzumab for 72 h. Statistical analysis was performed by Student′s t-test and one-way ANOVA, error bars indicate SD (***p < 0.001).

