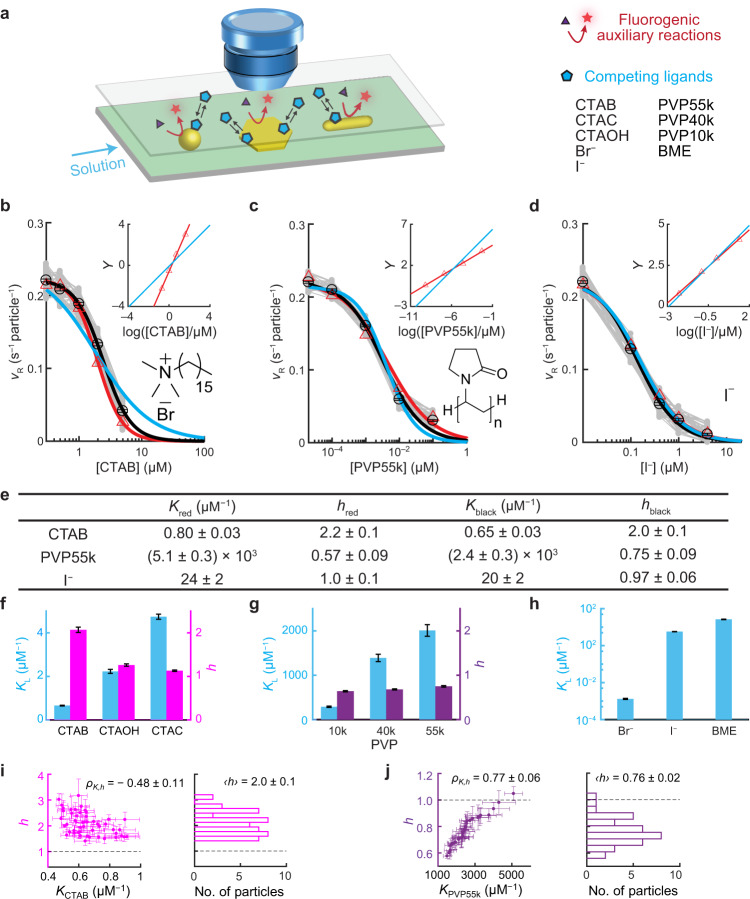
Fig. 1. COMPEITS imaging of cooperative ligand adsorption on single 5-nm Au nanoparticles.
a Schematic of the experimental design and scopes of particles and ligands. Fluorescence is excited via total-internal-reflection geometry (Supplementary Fig. 4). b–d Single-particle titration of fluorogenic auxiliary reaction rate vR vs. [L] of 50, 36, and 44 particles for CTAB (b), PVP55k (c), and I− (d), respectively (gray). Data points at [L] = 0 are placed on the y-axes manually. Red triangles: representative single-particle examples. Black circles: averages among particles. Red/black lines: corresponding fits with Eq. (1). Blue lines: Fits with h set to 1. Insets: the corresponding Hill plots of the representative single particles (points); lines: fits with the rearranged linear Hill form of Eq. (1) (Eq. S14) with h floating (red) or set to 1 (blue); the slope here is h. All fitting parameters summarized in e and Supplementary Table 2b. e Selected fitting parameters from b to d. f–h Particle-averaged adsorption equilibrium constants K (blue) and Hill coefficients h (magenta/purple) of CTA+ with different counter-anions (f), PVP with different molecular weights (g), and ligands showing no cooperativity (h). Distributions among individual particles are in Supplementary Fig. 12j–n. i, j Left: h vs. K for CTAB (i) and PVP55k (j); each point is from one nanoparticle; ρK,h: Pearson’s cross-correlation coefficient (see the definition in Supplementary Information section 4.3). Right: histograms of h. Error bars are s.e.m. in b–h for comparing the mean values and s.d. in i, j to show the uncertainty of the fitted parameters.

