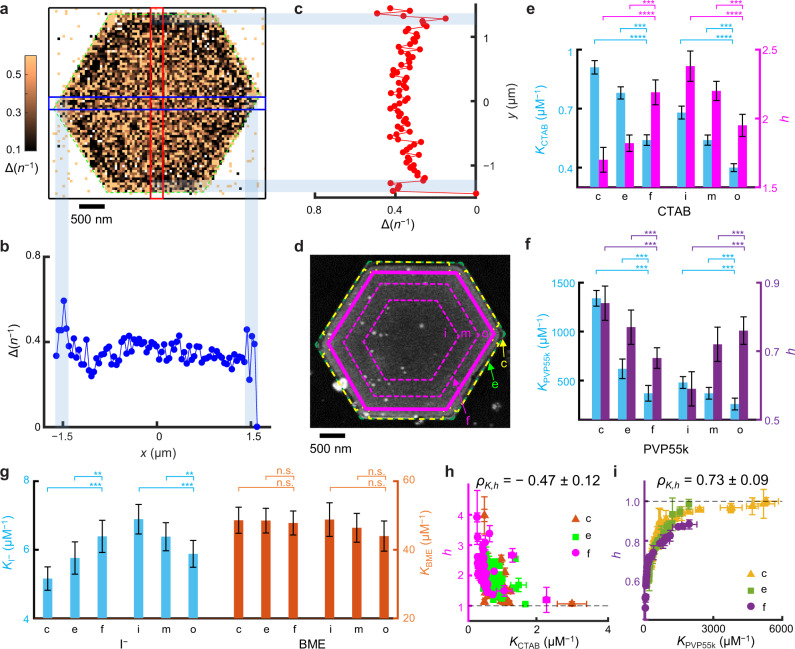
Fig. 2. Sub-particle variations of adsorption affinity and cooperativity on Au nanoplates.
a Representative COMPEITS image (402 nm2/pixel) of a Au nanoplate for CTAB adsorption calculated between [CTAB] = 0.5 and 0 μM. n: number of fluorogenic auxiliary reaction products detected over 45 min. Δ(n−1) based on Eq. (1) and Eq. S13. White/null pixels: occasional negative values or infinities from 1/0 calculations. b, c 1D projections of blue/red-boxed regions. d Corresponding SEM and scheme of segmentation (Supplementary Fig. 13a and Supplementary Fig. 7). Green dashed line: fitted outer contour of the mesoporous silica (~40 nm thick; Supplementary Fig. 1a–f) coated nanoplate; magenta solid line: boundary of the flat facet (f) region; and the space in-between are divided into corner (c) and edge (e) regions. The facet region is further divided into three equal-area, inner (i), middle (m), and outer (o) radial segments, separated by magenta dashed lines. e–g Facet and sub-facet differences in adsorption affinity (K) and cooperativity (h) of CTAB (e), PVP55k (f), I− and BME (g, no cooperativity) on 55, 40, 36, and 40 nanoplates, respectively. h, i Sub-particle h vs. K correlation for CTAB (h) and PVP55k (i). Each nanoplate provides one point per c, e, or f region. *p < 0.05; **p < 0.01; ***p < 0.001; ****p < 0.0001; n.s. nonsignificant (p > 0.05); paired Student’s t test. Error bars are s.e.m. in e–g, s.d. in h, i.

