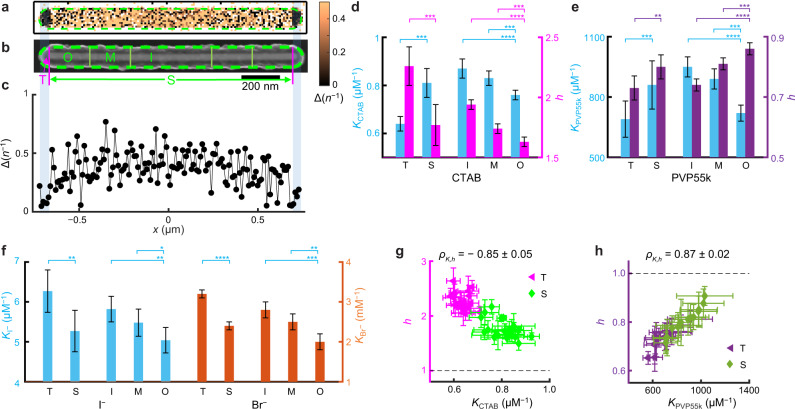
Fig. 3. Sub-particle variations of adsorption affinity and cooperativity on Au nanorods.
a–c COMPEITS (a) and SEM (b) images as in Fig. 2a–d, but for a Au nanorod (102 nm2/pixel); the 1D projection (c) is for the entire nanorod. d–f Facet and sub-facet differences in adsorption affinity (K) and cooperativity (h) of CTAB (d), PVP55k (e), and I− & Br− (f) on 20, 15, and 21 & 44 nanorods, respectively. g, h Sub-particle h vs. K correlation for CTAB (g) and PVP55k (h). Each nanorod provides one point per T or S region. *p < 0.05; **p < 0.01; ***p < 0.001; ****p < 0.0001; n.s. nonsignificant (p > 0.05); paired Student’s t test. Error bars are s.e.m. in d–f, s.d. in g, h.

