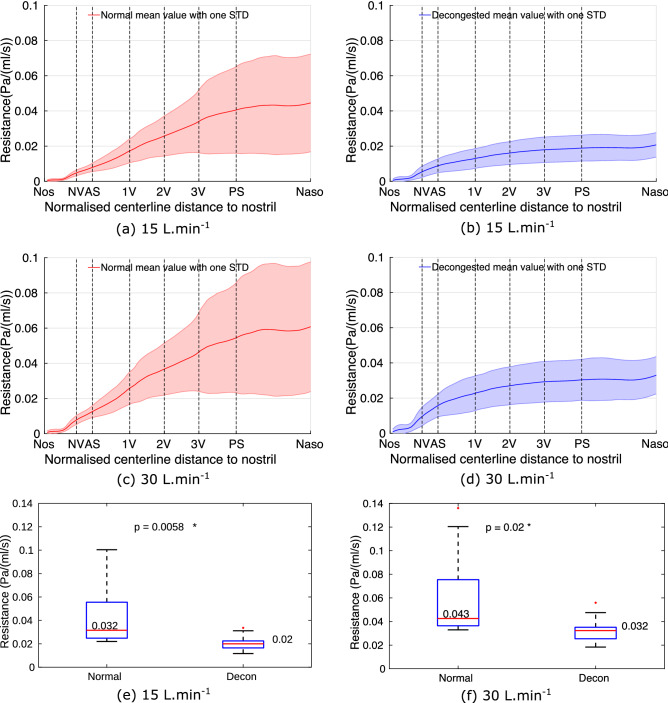
Figure 6.
Figure (a–d) shows the cumulative resistance. (a,b) are the mean cavity resistance distribution of all 10 subjects along the cavity centerline before and after decongestion, respectively. (c,d) shows the same but for flowrate at 30 L.min. The boxplots (e,f) show the effect of decongestant on the total nasal resistance at 15 L.min and 30 L.min. The results show that decongestion can significantly reduce nasal resistance for both at 15 L.min and 30 L.min.

