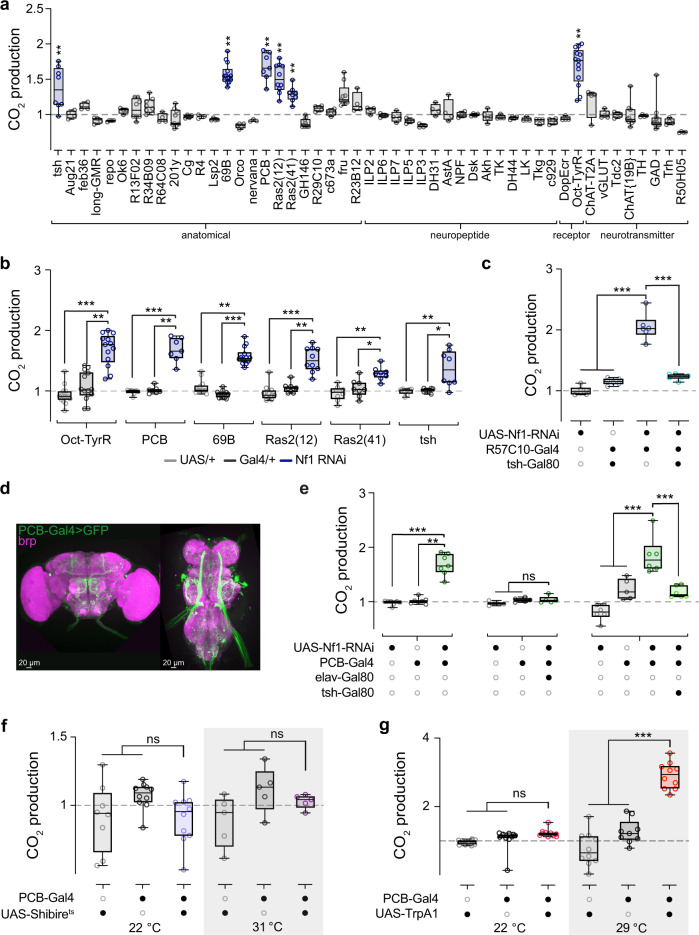
Fig. 2. A sparse set of neurons mediates metabolic rate via Nf1.
a Screen for neuronal subsets in which knocking down Nf1 elevates CO2 production. CO2 production from each Gal4 line is normalized to its own genetic controls. b Significant lines from a, showing RNAi and heterozygous controls. Sample sizes and p-values in Source data file for (a, b). *p < 0.05, **p < 0.01, ***p < 0.001 (Dunn’s test, two-sided; n = 7–14). c Normalized CO2 production, knocking down Nf1 pan-neuronally with R57C10-Gal4, with and without the tsh-Gal80 repressor. ***p < 0.001 (Sidak, two-sided; n = 6). d Expression of GFP in neurons labeled by the PCB-Gal4 driver. Bruchpilot (brp) counterstains the neuropil. Representative image shown. e Normalized CO2 production, knocking down Nf1 in neurons with the PCB-Gal4 driver (left) (**p < 0.01 ***p < 0.001 [Dunn’s test, two-sided; n = 7]), adding the elav-Gal80 repressor (middle) (experimental p = 0.0678 re: UAS-Nf1 RNAi/+, p > 0.999 re: PCB-Gal4/+ [Dunn’s test, two-sided; n = 5]), or adding the tsh-Gal80 repressor (right) (***p < 0.001 [Sidak, two-sided; n = 6]). The left data set is duplicated from (b) for comparison. f Normalized CO2 production when PCB-Gal4 neurons were blocked using UAS-Shibirets at 31 °C (right) and control temperature (22 °C, left). At 22 °C, experimental p > 0.999 re: UAS-Shibirets/+, p = 0.147 re: PCB-Gal4/+. (Sidak, two-sided; n = 8 UAS-Shibirets/+, n = 10 PCB-Gal4/+, and n = 10 experimental). At 31 °C experimental p = 0.590 re: UAS-Shibirets/+, p = 0.903 re: PCB-Gal4/+. (Sidak, two-sided; n = 5 per genotype). g Normalized CO2 production following activation of PCB-Gal4 neurons using UAS-TrpA1 at 29 °C (right) and control temperature (22 °C, left). At 22 °C experimental p = 0.269 re: UAS-TrpA1/+, p = 0.655 re: PCB-Gal4/+. (Sidak, two-sided; n = 10 per genotype). At 29 °C ***p < 0.001 (Sidak, two-sided; n = 10 UAS-TrpA1/+, n = 9 PCB-Gal4/+, n = 10 experimental). For each experiment, data were normalized to the mean of both controls at each temperature. Each “n” = single respirometer (containing 4 animals). Box plots—box: 1st to 3rd quartiles, median: line, whiskers: min–max, individual data points: circles. ns: not significant.

