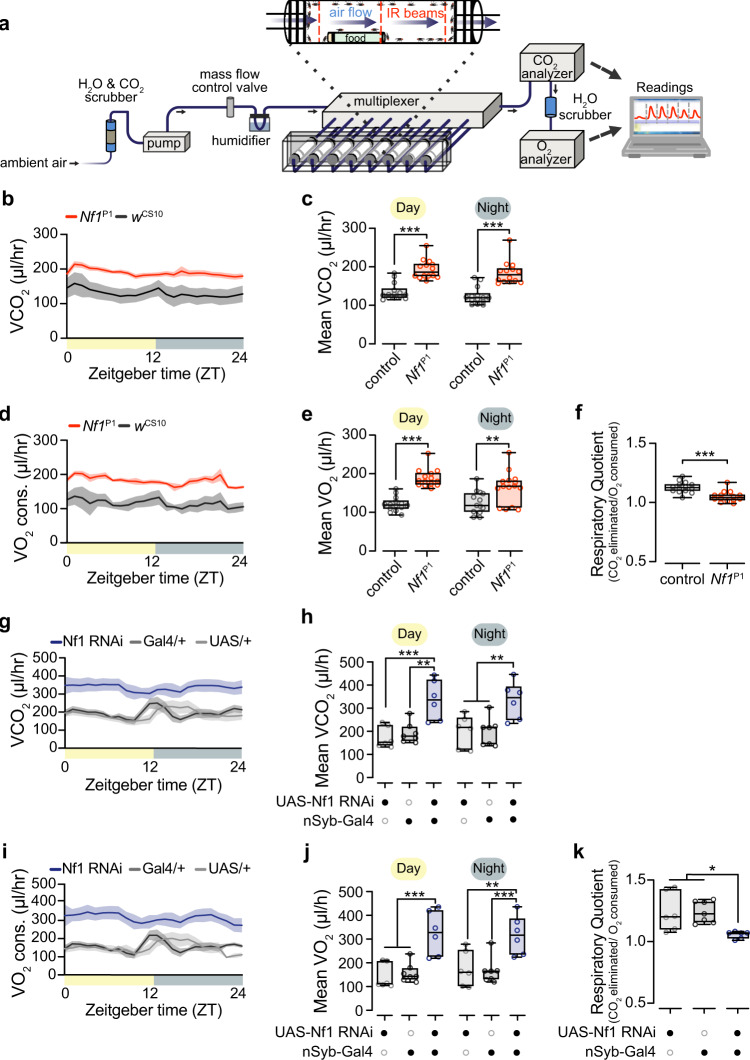
Fig. 3. Loss of Nf1 increases metabolic rate across the circadian photoperiod.
a O2 consumption and CO2 production, measured with indirect calorimetry. b CO2 production measured in Nf1P1 mutants and wCS10 controls, plotted in 1-h bins across the circadian photoperiod. c Quantification of CO2 production from (b) during day and night periods. ***p < 0.001 (Sidak, two-sided; n = 14 per genotype). d O2 consumption measured in Nf1P1 mutants and wCS10 controls. e Quantification of O2 consumption from (d) during day and night periods. Day experimental ***p < 0.001 re: control, night experimental **p = 0.003 re: control. (Sidak, two-sided; day: n = 14 per genotype, night: n = 13 control, n = 14 Nf1P1). f Respirometry quotient in Nf1P1 mutants and wCS10 controls. ***p < 0.001 (Mann–Whitney, two-sided; n = 14). g CO2 production, comparing pan-neuronal nSyb > RNAi with heterozygous controls. h Quantification of CO2 production from (g) during day and night periods. Day experimental ***p = 0.001 re: UAS-Nf1 RNAi/+, **p = 0.001 re: nSyb-Gal4/+. Night experimental **p = 0.004 re: UAS-Nf1 RNAi/+, **p = 0.002 re: nSyb-Gal4/+. (Sidak, two-sided; n = 6 UAS-Nf1 RNAi/+, n = 7 nSyb-Gal4/+, n = 6 experimental group). i O2 consumption, comparing pan-neuronal nSyb > RNAi lines with heterozygous controls. j Quantification of O2 production from (i) during day and night periods. Day experimental ***p = 0.0001 re: UAS-Nf1 RNAi/+, ***p = 0.003 re: nSyb-Gal4/+. Night experimental **p = 0.003 re: UAS-Nf1 RNAi/+, ***p = 0.001 re: nSyb-Gal4/+. (Sidak, two-sided; n = 6 UAS-Nf1 RNAi/+, n = 7 nSyb-Gal4/+, n = 6 experimental group). k Respirometry quotient in nSyb > RNAi lines and heterozygous controls. Experimental *p = 0.014 re: UAS-Nf1 RNAi, *p = 0.011 re: nSyb-Gal4/+ (Sidak, two-sided; n = 6 UAS-Nf1 RNAi/+, n = 7 nSyb-Gal4/+, n = 6 experimental group). Each “n” represents a single respirometer containing 25 animals. Box plots—box: 1st to 3rd quartiles, median: line, whiskers: min–max, individual data points: circles. Data are presented as mean values ± SEM in (b, d, g, and i).

