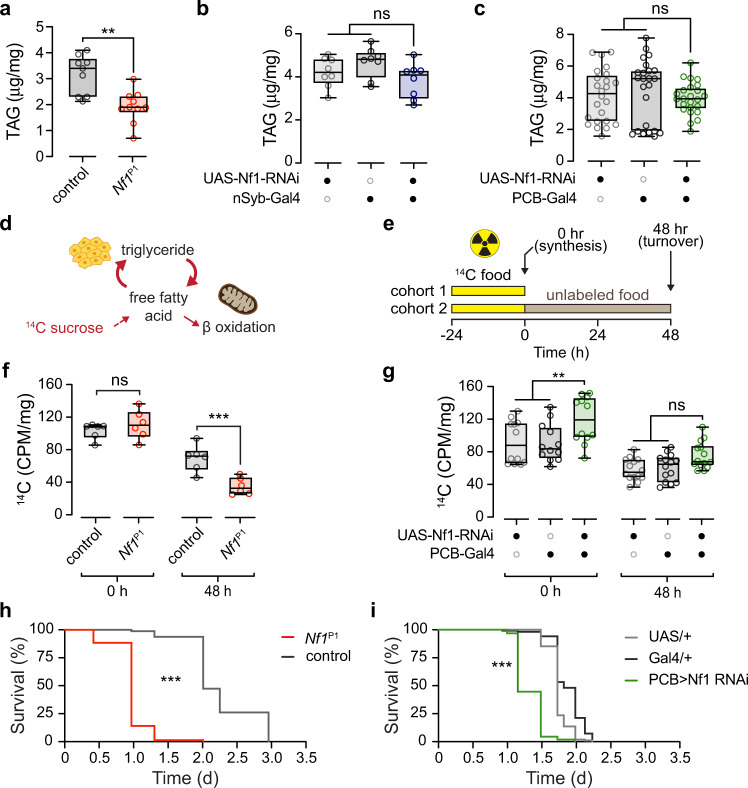
Fig. 5. Loss of Nf1 reduces starvation resistance and alters lipid stores and turnover kinetics.
a Quantification of total body triglyceride (TAG) content in Nf1P1 mutants (n = 9) and wCS10 controls (n = 10). **p = 0.002 (Mann–Whitney, two-sided). b Quantification of total TAG content of pan-neuronal nSyb-Gal4 > Nf1 RNAi compared to heterozygous controls. p = 0.095 (One-way ANOVA, two-sided; n = 8). c Quantification of total TAG content of PCB-Gal4 > Nf1 RNAi compared to heterozygous controls. p = 0.552 (Kruskal–Wallis, two-sided; n = 24). d Diagram of 14C sucrose radiolabeling and lipid turnover. e Experimental protocol of 14C sucrose radiolabeling for lipid turnover analysis. f Quantification of lipid turnover of Nf1P1 mutants via 14C sucrose radiolabeling. Radioactivity was measured as counts per minute (CPM) and normalized to fly weight (mg). At time point zero hours (0 h) p = 0.604, at 48-hours (48 h) ***p < 0.001, (Sidak, two-sided; n = 6 for both genotypes at both time points). g Quantification of lipid turnover of PCB-Gal4 > Nf1 RNAi via 14C sucrose radiolabeling. Radioactivity was measured as counts per minute (CPM) and normalized to fly weight (mg). At time point zero hours (0 h) experimental **p = 0.010 re: UAS-Nf1 RNAi/+, **p = 0.006 re: PCB-Gal4/+. At 48-hours (48 h) experimental p = 0.129 re: UAS-Nf1 RNAi, p = 0.252 re: PCB-Gal4/+. (Sidak, two-sided; n = 12 at 0-h, n = 14 at 48-h). h Lifespan under starvation, comparing Nf1P1 mutants (n = 78) and wCS10 controls (n = 80). ***p < 0.001 (X2(1) = 154.0, Mantel–Cox test, two-sided). i Lifespan under starvation, comparing PCB-Gal4 Nf1 knockdown (PCB > Nf1 RNAi) (n = 119) and UAS/+ (n = 120) and Gal4/+ (n = 100) controls. ***p < 0.001 (X2(2) = 281.3, Mantel–Cox test, two-sided). Each “n” in (a–c) represents a sample containing five animals. Each “n” in (f, g) represents a sample containing twenty animals. Box plots—box: 1st to 3rd quartiles, median: line, whiskers: min–max, individual data points: circles. ns: not significant.

