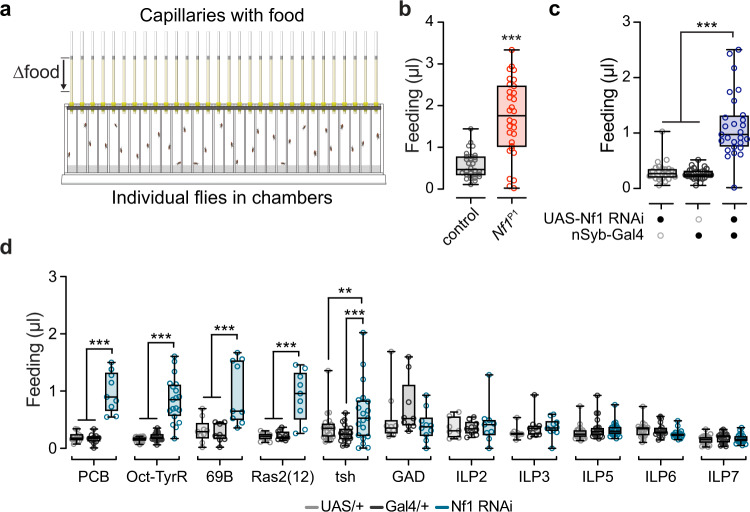
Fig. 6. Loss of Nf1 increases feeding.
a Illustration of the capillary feeding apparatus. b Feeding in Nf1P1 mutants and wCS10 controls. ***p < 0.001 (Mann–Whitney, two-sided; n = 30 per genotype). c Feeding with pan-neuronal Nf1 RNAi (driven by nSyb-Gal4) and heterozygous Gal4/+ and UAS/+ controls. ***p < 0.001 (Dunn’s test, two-sided; n = 20 per genotype). d Feeding measured with knockdown of Nf1 in different subsets of neurons with various Gal4 drivers. *p < 0.05, **p < 0.01, ***p < 0.001 (Sidak, two-sided; n = 7–20). Exact sample sizes and p-values found in Source data file for (d). Each “n” represents a single fly in a chamber. Box plots—box: 1st to 3rd quartiles, median: line, whiskers: min–max, individual data points: circles.

